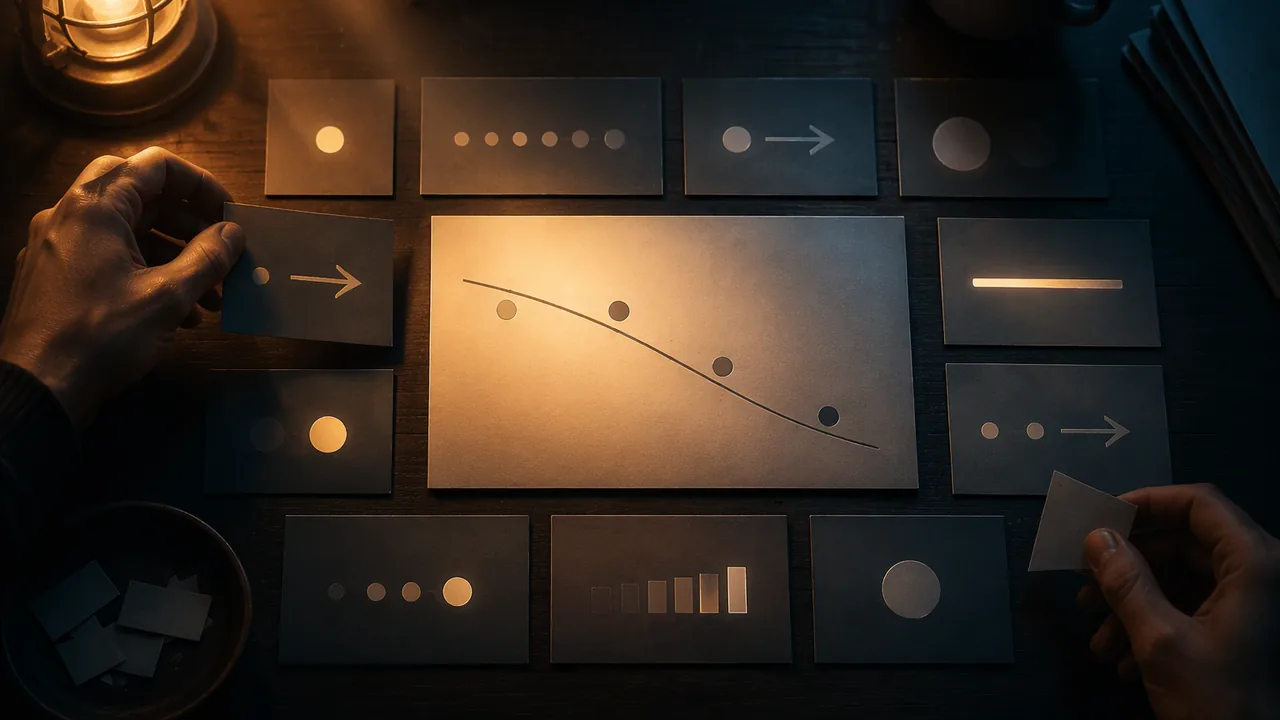
plan an explanatory infographic and a motion storyboard with a clear hierarchy and sequence, and explain regression accurately enough to show it visually.
Instruction
An explainer succeeds when the viewer understands one idea after another, in the right order. This workshop turns what you know about machine learning into a plan: a single-page infographic and a storyboard for a short motion piece.
Start with the sentence, not the picture. Write the one-sentence takeaway first, for example: “An image classifier learns by adjusting itself until its guesses match labels people gave to thousands of examples, and it is only as good as those examples.” Every element on the page must serve that sentence.
Hierarchy. Decide what the viewer should see first, second and third, then use size, contrast, color and position to enforce that order. The largest, highest-contrast element should carry the central idea. Secondary information is smaller or lower in contrast. Use no more than two typefaces and a limited palette, and give each color one meaning. If red means “model error”, do not also use it for a heading.
Sequence. Western readers scan from the top left, so a left-to-right or top-to-bottom flow feels natural. Numbered panels, arrows and repeated shapes lead the eye. For motion, a storyboard is a grid of frames, each with a sketch, a line of narration or caption and a note on movement (“cards slide into the TRAIN envelope”). Twelve frames is enough for a 60-90 second piece.
Showing regression. Some of you will explain a model that predicts a number. Regression can be drawn. Plot inputs on the horizontal axis and the value to predict on the vertical, then draw the line that best fits the points. Here is an illustrative example (the numbers are invented for teaching). Suppose five points relate minutes of walking per day to resting heart rate: (0, 80), (10, 78), (20, 75), (30, 73), (40, 70). The least-squares line falls 0.25 beats per minute for each extra minute of walking and crosses the vertical axis at 80.2. The fitted line is heart rate ≈ 80.2 − 0.25 × minutes, so for 24 minutes it predicts 80.2 − 6 = 74.2. Two design lessons follow. First, show the points as well as the line; the scatter shows the uncertainty. Second, say what the model cannot tell you: this pattern in invented data says nothing about cause, and a real study would need far more people.
Thumbnail first. Draw three quick, small layouts (about 5 by 7 cm each) that solve the page in different ways: a vertical flow, a circular cycle and a comparison of two panels. Choose one, and explain why in two sentences. Then refine it at full size in pencil or in a free tool such as Inkscape, Krita or GIMP.
Accuracy check. Before you add any color, read your plan aloud against the unit’s facts: labeled data, features, training, testing on unseen examples and at least one source of error. If any are missing, the design is not finished.
📖 Read for this lesson
The reading opens over the lesson; close it to come back to exactly where you were. The checks below draw on it.
Formative check
Work through these before moving on. They are not graded — they tell you whether the standard below has landed yet.
Using the illustrative model heart rate = 80.2 – 0.25 x minutes, what does it predict for 32 minutes of walking?
Your infographic uses red for ‘model error’ in one panel and for section titles elsewhere. What is the problem?
Showing the data points as well as the regression line helps the viewer see how uncertain the prediction is.
Write your one-sentence takeaway, then describe the three thumbnail layouts you drew and explain in two sentences which one you chose and why.
How confident are you that you can plan an explainer with a clear hierarchy and sequence, and represent a classification or regression model accurately?
Practice
Work these on paper or in your notebook, then open Check your answer. Aim for all of Fluency and Application; try at least one Challenge.
Printable version: this unit’s practice workbook (PDF)
Fluency
Build speed and accuracy with the core skill.
- Define thumbnail, storyboard and palette as the lesson uses them.
Check your answer
Answer: A thumbnail is a small, fast sketch used to compare layout options. A storyboard is a sequence of sketched frames with captions and movement notes that plans a time-based work. A palette is the limited set of colors chosen for a work, each with a consistent role.All three are planning tools: thumbnails choose the layout, the storyboard plans time, the palette fixes color meanings. - What three things does each storyboard frame contain, according to the lesson? How many frames is enough for a 60-90 second piece?
Check your answer
Answer: A sketch, a line of narration or caption, and a note on movement. Twelve frames.Example movement note: ‘cards slide into the TRAIN envelope’. - Using the illustrative model heart rate = 80.2 – 0.25 x minutes, compute the prediction for (a) 0 minutes, (b) 20 minutes, (c) 40 minutes of walking.
Check your answer
Answer: (a) 80.2; (b) 75.2; (c) 70.2.(a) 80.2 – 0 = 80.2; (b) 0.25 x 20 = 5, 80.2 – 5 = 75.2; (c) 0.25 x 40 = 10, 80.2 – 10 = 70.2. The numbers are invented for teaching.
Application
Use the skill in context. Show your reasoning.
- The invented data point (20, 75) has a predicted value of 75.2 on the line. What is the difference between the actual and predicted value, and what does showing the points as well as the line tell the viewer?
Check your answer
Answer: 75 – 75.2 = -0.2 (the point is 0.2 below the line). Showing the points shows how far real values fall from the prediction, which shows the uncertainty.Predicted: 80.2 – 0.25 x 20 = 75.2. Actual minus predicted = 75 – 75.2 = -0.2. - A student writes under the regression chart: ‘Walking lowers your heart rate by 0.25 beats per minute for every minute.’ Name two problems with this sentence, using the lesson.
Check your answer
Answer: First, the pattern comes from invented data and says nothing about cause. Second, five points are far too few; a real study would need far more people. The honest sentence describes the fitted line as a pattern in these example points.The lesson’s two design lessons: show the points, and say what the model cannot tell you. - Write a one-sentence takeaway for an infographic explaining how an image classifier learns, then list the five unit facts the accuracy check requires.
Check your answer
Answer: Model takeaway: ‘An image classifier learns by adjusting itself until its guesses match labels people gave to thousands of examples, and it is only as good as those examples.’ Facts: labeled data, features, training, testing on unseen examples, and at least one source of error.Every element on the page must serve the takeaway; if a required fact is missing, the design is not finished. - An infographic uses four typefaces and uses blue for ‘training data’, for headings and for the background of the test panel. Give two specific fixes based on the lesson’s hierarchy rules.
Check your answer
Answer: Use no more than two typefaces. Give blue one meaning only (training data) and choose another color, or neutral black, for headings and the test-panel background.Each color in the palette has one consistent role; a limited set of typefaces keeps the hierarchy clear. - Describe the three thumbnail layouts the lesson asks for, and name one explainer idea each would suit.
Check your answer
Answer: A vertical flow (step-by-step: labeled data, training, testing); a circular cycle (a repeating loop, such as a model adjusting until its guesses match labels); a comparison of two panels (one-feature rule versus two-feature model, or supervised versus unsupervised).Thumbnails are about 5 by 7 cm and fast; the point is comparing solutions before choosing one and explaining the choice in two sentences.
Review
Keep earlier skills sharp.
- Review 1.3: Your storyboard frame says ‘The AI understands the X-ray.’ Using the accuracy criterion, rewrite the caption.
Check your answer
Answer: ‘The model outputs a probability for each X-ray, learned from labeled examples.’On accuracy, the model does not understand; it outputs a probability. - Review 1.2: A sickle cell drawn 16 mm long and 4 mm wide: what is its ratio, and what does the rule ‘ratio > 2.0 means sickle’ predict?
Check your answer
Answer: Ratio 4.0; the rule predicts sickle-shaped.16 / 4 = 4.0, which is greater than 2.0.
Technique Sheet: Page Grid, Type, Contrast, Honest Regression and a Twelve-Frame Storyboard
SLS original technique sheet with invented teaching data; contrast ratios computed with the WCAG 2.1 relative-luminance formula (W3C, success criterion 1.4.3); retrieved Sept. 26, 2026 · SLS original
Why this reading. The workshop asks you to plan a hierarchy, a sequence, three thumbnails and six storyboard frames, and to draw a regression correctly. This is the technique sheet with real measurements and one complete worked example you can follow with pencil and ruler. Everything here is SLS original. The example data are invented for teaching. The one outside standard cited, the W3C’s WCAG 2.1 contrast rule, is a published accessibility guideline, not text reproduced here.
Step 1. The sentence
Write it before any drawing. Worked example: “A program learns to spot sickle-shaped cells by adjusting itself until its guesses match labels people gave it, and it is only as good as those labeled examples.” Test: can you point to a piece of the page that serves each clause (adjusting itself, labels people gave, only as good as the examples)? If a piece serves none of them, cut it.
Step 2. Page and hierarchy
Page. US Letter portrait, 8.5 × 11 in, margins 0.5 in all round, leaving a live area of 7.5 × 10 in. Divide it into three bands: title band 1.5 in tall at the top, working band 7.5 in, source line 1 in at the bottom. Type scale (each step about 1.5 times the last): title 36 pt, panel headings 24 pt, labels 14 pt, body and sources 10 pt at the smallest. Levels: first (largest, highest contrast) the takeaway or the central picture; second the panel headings; third labels; fourth sources.
Contrast. WCAG 2.1 success criterion 1.4.3 asks for a contrast ratio of at least 4.5:1 for normal text and 3:1 for large text (18 pt, or 14 pt bold). Computed with the WCAG formula, these pairs on white or navy pass or fail as shown:
| Text color | Background | Contrast ratio | Use |
|---|---|---|---|
| #1F2A44 (dark navy) | #FFFFFF (white) | 14.3 : 1 | Body text and headings: passes |
| #C1440E (burnt orange) | #FFFFFF | 5.1 : 1 | Highlight for a labeled example: passes for all text |
| #0B6E6E (teal) | #FFFFFF | 6.1 : 1 | Second highlight, for the program’s output: passes |
| #767676 (gray) | #FFFFFF | 4.5 : 1 | The lightest gray that still passes for small text |
| #9AA0A6 (light gray) | #FFFFFF | 2.6 : 1 | Fails: do not use for a source line or a method note |
| #E8A33D (amber) | #FFFFFF | 2.2 : 1 | Fails on white; on #1F2A44 it is 6.6 : 1 and passes |
One color, one meaning. Worked assignment: burnt orange = a labeled training example; teal = what the program outputs; navy = all other text. Neither highlight color is ever used for a heading.
Step 3. Three thumbnails, then one choice
Draw each in a 5 × 7 cm rectangle in two minutes, no detail. Worked example: (a) vertical flow: five boxed steps from top to bottom (examples, features, training, testing, limits) with an arrow between each; (b) cycle: the same steps around a loop, with “test on new examples” feeding back into “adjust”; (c) comparison: two panels side by side, “trained on varied examples” and “trained on one clinic’s examples,” each ending in a test result. Choice, in two sentences: “I chose (c) because the sentence ends with ‘only as good as the examples,’ and a comparison shows that without a caption. I lose the step-by-step order, so I will number the panels.”
Step 4. Showing a regression honestly
SLS original invented data: minutes of walking per day against resting heart rate, five people: (0, 80), (10, 78), (20, 75), (30, 73), (40, 70). The least-squares line is heart rate = 80.2 − 0.25 × minutes (slope −0.25, intercept 80.2). The five vertical gaps between each point and the line (the residuals) are −0.2, +0.3, −0.2, +0.3, −0.2 beats per minute. Predicting 24 minutes: 80.2 − 0.25 × 24 = 74.2.
To draw it at 8 × 5 cm: horizontal axis 0 to 40 minutes at 0.2 cm per minute; vertical axis 65 to 85 beats per minute at 0.25 cm per beat, measured up from the bottom-left corner. The points are at (0, 3.75), (2.0, 3.25), (4.0, 2.5), (6.0, 2.0), (8.0, 1.25) cm. The line runs from (0, 3.8) to (8.0, 1.3) cm. Draw the five points as dots and the line thinner than the dots, so the viewer sees the scatter. Caption it truthfully: “Invented data, five people. This pattern says nothing about cause.” If the audience cannot see the scatter, they cannot see how uncertain the prediction is.
Step 5. Storyboard
Sheet. Landscape Letter, margins 0.5 in. Four columns by three rows makes twelve frames. Each frame is a 16:9 rectangle 2.4 in wide and 1.35 in tall, with a 0.13 in gutter between columns, and under each frame four lines for narration and one line for movement. At 6 seconds per frame, twelve frames run 72 seconds, inside the 60 to 90 seconds asked for. Number each frame.
Worked frames 1 to 6 (invented for the example):
| # | Sketch | Narration (spoken) | Movement | Sec. |
|---|---|---|---|---|
| 1 | A hand drawing a round cell and a sickle cell on cards | “Doctors and scientists start by labeling examples.” | Cards fade in one at a time, orange border | 6 |
| 2 | Two piles of cards, TRAIN and TEST | “Most cards are for learning. A few are kept hidden for later.” | Cards slide into two envelopes | 6 |
| 3 | One card with a ruler drawn across it | “The program measures features, such as how long and thin a shape is.” | Ruler line draws itself; ratio appears | 6 |
| 4 | Number line of ratios, cards as dots | “It looks for a rule that separates the two kinds.” | Threshold line moves until dots split | 6 |
| 5 | A new card in a teal outline, question mark | “Now it sees a card it has never seen.” | Card flips; the program’s guess appears in teal | 6 |
| 6 | The guess with a red X on a wrong one | “Sometimes it is wrong, and how often is what testing measures.” | X pulses once | 6 |
(In this example red is used only for the marked error, so it keeps one meaning; the tint in frame 5 is teal because teal means “the program’s output.”)
Step 6. Accuracy check before color
Read the plan aloud against five items: labeled data (who labeled it), features, training, testing on unseen examples, and at least one source of error. For each, name the frame or panel where it appears. Any item with no home means the design is unfinished. In the example above the storyboard has all five in frames 1 to 6, and the “only as good as the examples” error source is in panel (c) of the infographic.
Sources: W3C WCAG 2.1, Understanding Success Criterion 1.4.3: Contrast (Minimum) (w3.org)