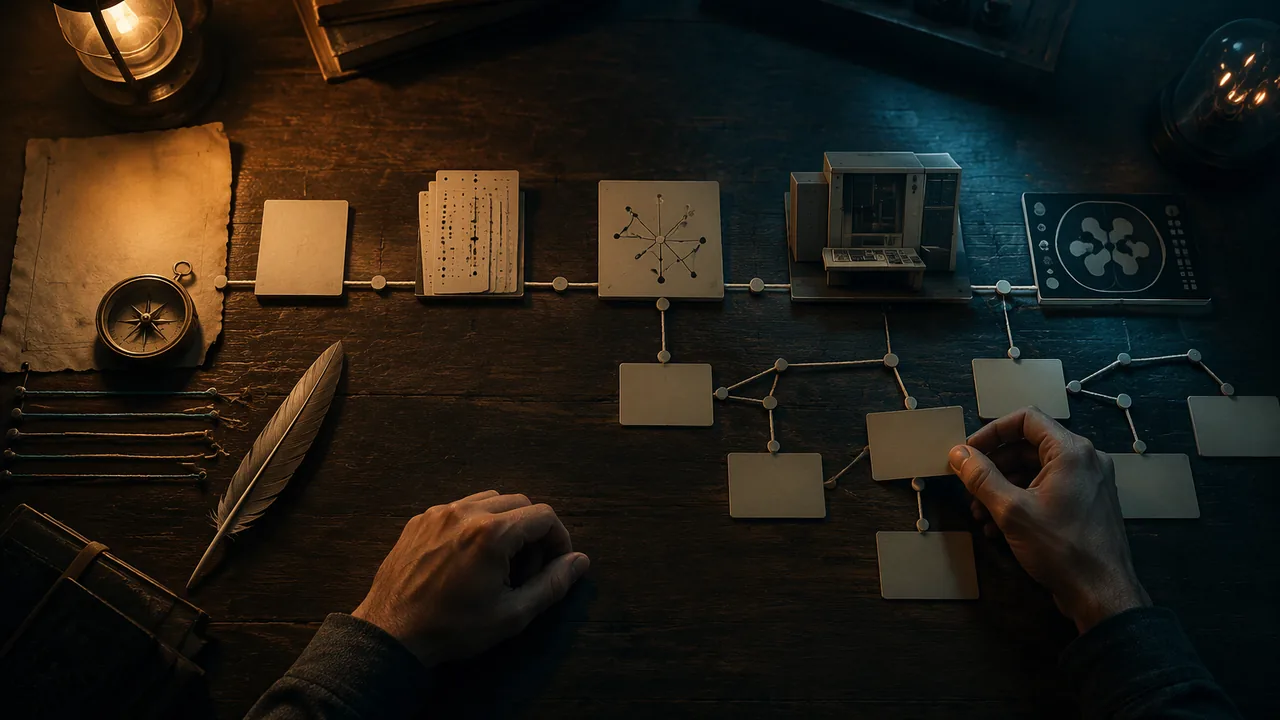
analyze how a timeline’s design shapes the story it tells, and summarize the documented milestones in the history of AI and of AI in medicine.
Instruction
A timeline looks neutral, but every one is an argument. The designer chooses where it starts, which events count, how much space each era gets and what sits at the center. You will build a history of an AI innovation this unit, so begin by studying how timelines tell stories.
Joseph Priestley, A Chart of Biography (1765). Priestley, better known as a chemist, drew the lives of about two thousand historical figures as horizontal lines along a shared time axis, grouped by field. A reader could see at a glance who lived at the same time as whom. His design choice of equal space for equal years was new and influential. It also shows a limit: his chart is built almost entirely from European men, so its picture of who mattered reflects the sources and assumptions of its maker. Your timeline will have a point of view too; the job is to make it deliberate and honest.
Design questions for any timeline. Is time drawn to scale, or are the events evenly spaced? Scale shows gaps and bursts; even spacing shows sequence but hides tempo. What is on the main line and what is a side branch? How are uncertain dates shown? A good timeline marks a date as approximate when it is.
A verified history of AI. These milestones are well documented. In 1950 Alan Turing published “Computing Machinery and Intelligence”, which asked whether machines can think and proposed an imitation game as a test. A 1955 proposal by John McCarthy, Marvin Minsky, Nathaniel Rochester and Claude Shannon used the phrase “artificial intelligence” for a summer workshop held at Dartmouth College in 1956, usually taken as the founding of the field. In the late 1950s Frank Rosenblatt built the perceptron, an early learning machine loosely modeled on neurons. In 1966 Joseph Weizenbaum at MIT described ELIZA, a program that imitated a psychotherapist by rephrasing users’ words; he was disturbed by how readily people confided in it. In the 1970s Stanford researchers built MYCIN, an expert system that recommended antibiotics for certain infections using hundreds of hand-written rules; it performed well in evaluations but was not used in routine care. Periods of disappointment and reduced funding in the 1970s and late 1980s are called AI winters. In 1986 Rumelhart, Hinton and Williams popularized backpropagation for training multi-layer neural networks. In 1997 IBM’s Deep Blue defeated the world chess champion Garry Kasparov. In 2012 a deep neural network (AlexNet) won the ImageNet image-recognition competition by a wide margin, starting the deep-learning era. In April 2018 the FDA authorized IDx-DR, which it described as the first device authorized to give a screening decision for diabetic retinopathy without a clinician interpreting the image. In 2020 DeepMind’s AlphaFold 2 predicted protein structures with accuracy that transformed the field, work recognized in the 2024 Nobel Prize in Chemistry. In late 2022 OpenAI released ChatGPT, bringing large language models to a mass public.
Reading the pattern. Notice the rhythm: rule-based systems, then learning from data, then very large models trained on very large datasets. Notice too that medicine appears early (MYCIN) but the first autonomous clinical authorization comes decades later. That gap between what works in a lab and what is trusted in a clinic is a story your timeline can tell.
📖 Read for this lesson
The reading opens over the lesson; close it to come back to exactly where you were. The checks below draw on it.
Formative check
Work through these before moving on. They are not graded — they tell you whether the standard below has landed yet.
Which ordering of these milestones is correct?
MYCIN, the 1970s expert system, was widely used to prescribe antibiotics in hospitals.
A timeline spaces every event evenly regardless of date. What does it hide?
Priestley’s chart reflects the sources and assumptions of its maker. Name one choice you will have to make in your own AI timeline that will reflect your point of view, and how you will make it honest.
How confident are you that you can analyze how a timeline’s design shapes its story, and summarize the documented history of AI accurately?
Practice
Work these on paper or in your notebook, then open Check your answer. Aim for all of Fluency and Application; try at least one Challenge.
Printable version: this unit’s practice workbook (PDF)
Fluency
Build speed and accuracy with the core skill.
- Give the year for each milestone: (a) Turing’s ‘Computing Machinery and Intelligence’; (b) the Dartmouth workshop; (c) ELIZA described by Weizenbaum; (d) Deep Blue defeats Kasparov; (e) AlexNet wins ImageNet.
Check your answer
Answer: (a) 1950; (b) 1956; (c) 1966; (d) 1997; (e) 2012.These are the lesson’s verified milestones. The phrase ‘artificial intelligence’ came from the 1955 proposal for the 1956 workshop. - Define expert system, AI winter and deep learning, and give the lesson’s example for the first term.
Check your answer
Answer: An expert system applies many hand-written if-then rules gathered from human experts (example: MYCIN, 1970s, which recommended antibiotics). An AI winter is a period of reduced funding and interest after expectations were not met. Deep learning is machine learning with many-layered neural networks that learn their own features from raw data.The three terms trace the rhythm the lesson names: rules, then disappointment, then learning from data. - What design choice made Priestley’s 1765 Chart of Biography new, and what limit does the lesson point out?
Check your answer
Answer: Equal space for equal years: about two thousand lives drawn as horizontal lines on one shared time axis, grouped by field. Its limit is that it is built almost entirely from European men, so its picture of who mattered reflects its maker’s sources and assumptions.Every timeline has a point of view; the job is to make yours deliberate and honest.
Application
Use the skill in context. Show your reasoning.
- A to-scale timeline runs from 1950 to 2022 at 2 cm per year. How far from the start should these events be placed: Dartmouth (1956), MYCIN-era work (draw at 1972), IDx-DR (2018), ChatGPT (2022)?
Check your answer
Answer: Dartmouth 12 cm; 1972 at 44 cm; IDx-DR 136 cm; ChatGPT 144 cm.(1956 – 1950) x 2 = 12; (1972 – 1950) x 2 = 44; (2018 – 1950) x 2 = 136; (2022 – 1950) x 2 = 144. The 1970s date for MYCIN should be marked approximate on the card. - How many years passed between the Dartmouth workshop and the FDA’s 2018 authorization of IDx-DR? What story does the lesson say that gap can tell?
Check your answer
Answer: 62 years. It shows the gap between what works in a lab and what is trusted in a clinic: medicine appeared early (MYCIN) but the first autonomous clinical authorization came decades later.2018 – 1956 = 62. - Two designers draw the same 12 AI milestones. Designer A spaces them evenly; Designer B draws them to scale. Which one shows the long gap between 1966 and 1986, and which one is better for showing only the order of events? Explain.
Check your answer
Answer: Designer B’s to-scale timeline shows the gap, because equal distances stand for equal years. Designer A’s evenly spaced version shows sequence clearly but hides tempo, the gaps and bursts.Scale shows gaps and bursts; even spacing shows sequence but hides tempo. - Sort these into the lesson’s three-part rhythm (rule-based systems; learning from data; very large models on very large datasets): MYCIN, AlexNet, ChatGPT, backpropagation popularized in 1986, AlphaFold 2.
Check your answer
Answer: Rule-based: MYCIN. Learning from data: backpropagation (1986), AlexNet (2012). Very large models: ChatGPT (2022); AlphaFold 2 (2020) also belongs to the large-model, large-data era.AlphaFold 2 can reasonably be placed in either of the last two phases if the answer explains why; the key contrast is hand-written rules versus learning from data.
Review
Keep earlier skills sharp.
- Review 1.1: Which of Nightingale, Minard and Neurath combined time with other data on one image, and what did time run along?
Check your answer
Answer: Minard. His map shows the army’s band moving across place over time, with a temperature line beneath it.One image carries size, place, direction, time and temperature.
Priestley’s Chart of Biography, and the Turing and Dartmouth Texts in Their Authors’ Words
J. Priestley, A Description of a Chart of Biography (1764/1765), Internet Archive adescriptionach00priegoog; A Chart of Biography (1765), Internet Archive bim_eighteenth-century_a-chart-of-biography-to_priestley-joseph_1765; A. M. Turing, Computing Machinery and Intelligence, Mind 59(236), 1950; McCarthy et al., Dartmouth proposal, Aug. 31, 1955 (jmc.stanford.edu); J. Weizenbaum, ELIZA, CACM 9(1), 1966; retrieved Sept. 26, 2026 · Public domain (Priestley, 1764/1765), with brief quotations from Turing (1950) and the Dartmouth proposal (1955), cited; SLS original scale calculations
Why this reading. The lesson asks you to analyze a timeline’s design and to summarize documented milestones, but it shows you neither Priestley’s chart nor any primary document. This reading gives Priestley’s own rules for reading his chart, the two founding texts of AI in the words of their authors, and the arithmetic of a timeline drawn to scale. What to look for: every choice Priestley says he made, and what each choice includes or leaves out.
1. Joseph Priestley, A Chart of Biography (1765) and A Description of a Chart of Biography (1764/1765)
The record. Engraved chart, about three feet by two (per Priestley), dedicated to Hugh, Lord Willoughby of Parham, London, 1765. The chart is digitized at the Internet Archive (identifier bim_eighteenth-century_a-chart-of-biography-to_priestley-joseph_1765); its printed guide, A Description of a Chart of Biography, is at the Internet Archive (identifier adescriptionach00priegoog, a Google Books scan, and the 1765 edition bim_eighteenth-century_a-description-of-a-chart_priestley-joseph_1765). Public domain. Retrieved 26 September 2026. The words below are quoted or paraphrased from the guide’s printed text (the scan uses the long s, so I have modernized it).
What the design looks like. A single wide sheet. A horizontal time scale runs across the top and bottom margins, divided into equal centuries; the guide says it covers 1200 years before the Christian era to 1800 after. Each person is one line whose left end is the year of birth and whose right end is the year of death, so the line’s length is the length of the life. The name is written along the line. The names are sorted into horizontal bands (Priestley says “columns”), each labeled at its end: statesmen and warriors first, then bands for people of letters and learning, mathematicians and natural philosophers, and others. The guide says the chart holds “about two thousand names of persons the most distinguished in the annals of fame.”
What Priestley says he did.
- One scale. He contrasts his design with his earlier chart of history, which uses several scales. In the biography chart the time scale is the same everywhere, and he says a shifting scale makes the viewer’s imagination “imposed upon.” Equal centuries take equal space.
- Length as life. Length in space stands for length in time. His test: a reader who is only told that Plato died 348 BC aged 81 and Xenophon 359 BC aged about 90 has trouble saying who was born first without arithmetic, but a reader looking at the chart sees it at once.
- Marks for uncertainty. A full line means the dates are certain. A dotted or broken line means they are not. A single dot at one end means the person was born or died “a little before or after” the date. A dot just under the end of a line means “about” that time. If a writer is only known to have “flourished” at a time, he draws a short full line, about two thirds before the date and one third after it, with three dots before and two after. If even the century is uncertain, there is no full line, only dots.
- Selection. He names the reference works he compared to choose names and dates: Universal History, a biographical dictionary, Fabricius’s Bibliotheca Graeca, Vossius, Stanley’s History of Philosophy, Biographia Britannica, Freind’s History of Physic, Walpole’s Anecdotes of Painting, and others, and says some dates cost him “whole days” without a result.
Analyze the design. Scale: even, so tempo is visible. Main line and branches: the guide says names with only a date belong in the first band, statesmen and warriors, and everyone else is sorted into labeled bands by kind of work, so the hierarchy is by category, not by date. Uncertainty: shown by the shape of the line, a solution your own timeline can borrow. Point of view: every entry depends on the reference works he lists, which are European works; the choice of what counts as “distinguished” is his. Ask who a chart made from different sources would include.
2. The founding texts, in their authors’ words
A. M. Turing, “Computing Machinery and Intelligence,” Mind 59 (236), October 1950, pp. 433–460. The paper opens: “I propose to consider the question, ‘Can machines think?’” Because “think” is hard to define, he proposes replacing it with a game, the “imitation game,” played by an interrogator and two hidden players. Near the end he states a prediction and a belief: “in about fifty years’ time it will be possible, to programme computers, with a storage capacity of about 109, to make them play the imitation game so well that an average interrogator will not have more than 70 per cent chance of making the right identification after five minutes of questioning”; and that the original question is “too meaningless to deserve discussion.” Note what is documented: a question and a test, not a working thinking machine. (Read from a publicly available copy hosted by UMBC, retrieved 26 September 2026; quoted briefly, as the paper’s copyright status in the United States was not verified.)
J. McCarthy, M. L. Minsky, N. Rochester and C. E. Shannon, “A Proposal for the Dartmouth Summer Research Project on Artificial Intelligence,” dated August 31, 1955. It proposes “that a 2 month, 10 man study of artificial intelligence be carried out during the summer of 1956 at Dartmouth College in Hanover, New Hampshire.” Its working conjecture is that every aspect of learning or any other feature of intelligence can in principle be so precisely described that a machine can be made to simulate it. Its list of problems includes automatic computers, using language, neuron nets, the size of a calculation, and self-improvement. Two things are documented: the proposal is dated 1955, and the workshop it proposed was for the summer of 1956, which is why sources differ on “the year AI began.” (Hosted at jmc.stanford.edu, retrieved 26 September 2026; one quotation.)
J. Weizenbaum, “ELIZA,” Communications of the ACM 9 (1), January 1966, pp. 36–45, DOI 10.1145/365153.365168. Its abstract says ELIZA runs on MIT’s MAC time-sharing system and analyzes input sentences with decomposition rules triggered by keywords, generating responses with reassembly rules. That is a fact about the method: keyword rules, not understanding.
3. Drawing time to scale: the arithmetic
SLS original worked example. A 140 cm string covers 1950 to 2022, 72 years, so each year takes 140 ÷ 72 = 1.94 cm and each decade 19.4 cm. Positions in centimeters from the 1950 end: Turing paper 1950, 0; Dartmouth proposal 1955, 9.7; Dartmouth workshop 1956, 11.7; ELIZA 1966, 31.1; backpropagation popularized 1986, 70.0; Deep Blue 1997, 91.4; AlexNet 2012, 120.6; IDx-DR authorized 2018, 132.2; AlphaFold 2 2020, 136.1; ChatGPT 2022, 140.0. (Dates other than the documents above are those in the lesson; verify each in Lesson 2.2 before you use it.) Drawn to scale, four of the ten marks crowd into the first 31 cm (1950 to 1966), then there is a 39 cm gap to 1986, and five marks fall in the last 49 cm (1997 to 2022). Evenly spaced, the same marks would look like steady progress; the scale shows bursts and gaps.
Sources: Priestley, A Description of a Chart of Biography, Internet Archive (archive.org); Priestley, A Chart of Biography (1765), Internet Archive (archive.org); Turing, Computing Machinery and Intelligence, Mind 59(236), 1950 (publicly available copy, UMBC) (courses.cs.umbc.edu); McCarthy et al., A Proposal for the Dartmouth Summer Research Project on Artificial Intelligence (1955) (jmc.stanford.edu); Weizenbaum, ELIZA, Communications of the ACM 9(1), 1966 (dl.acm.org)