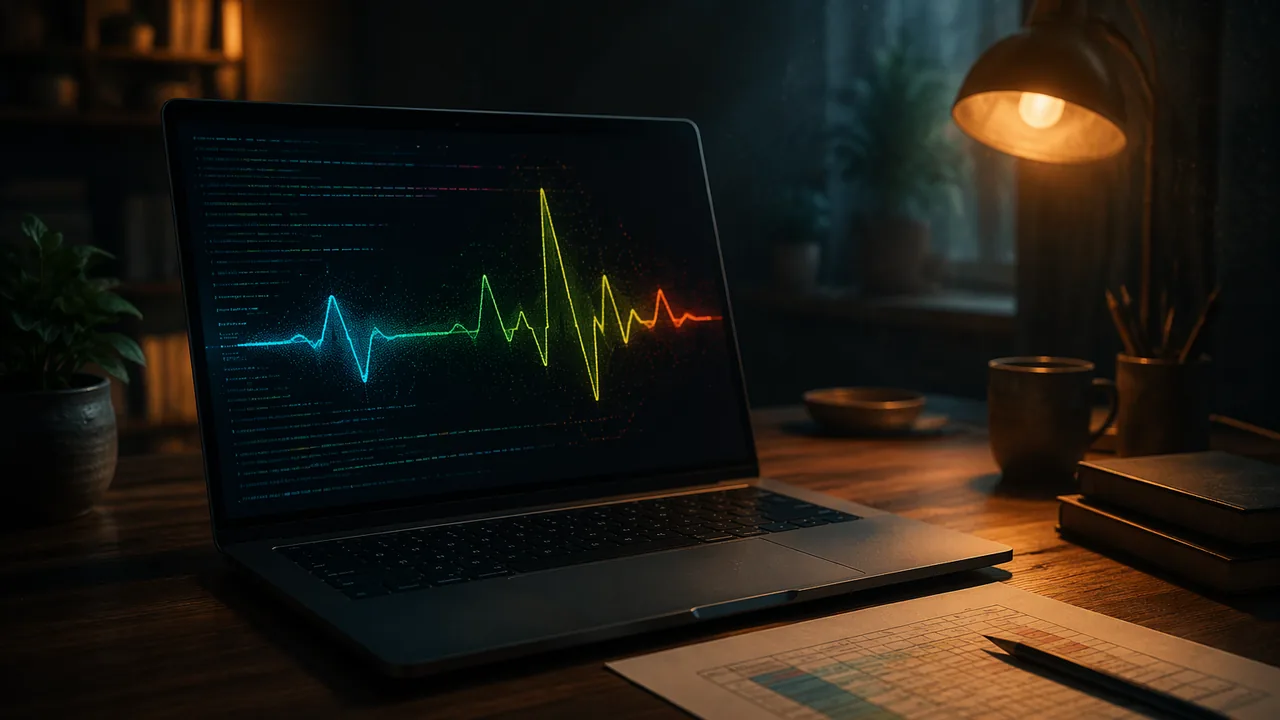
work with heart-rate data responsibly and code an animated p5.js visualization in which each visual variable is deliberately mapped to a data value.
Instruction
In this lab you turn heartbeats into a moving image. You will use p5.js, a free JavaScript library for artists made by the Processing Foundation, in its web editor at editor.p5js.org. You can run sketches without an account; to keep your work, download it as a file.
The data. You will use the provided illustrative dataset. If you are curious, you may also try the sketch privately with a few of your own resting pulse counts; that is optional, you never submit or share them, and no reading in this course means anything medical. The illustrative dataset (invented for teaching, not a real patient) is twelve readings taken one minute apart: 72, 74, 71, 73, 75, 72, 70, 96, 98, 74, 73, 72 beats per minute.
How a p5.js sketch works. setup() runs once: it creates the canvas. draw() runs again and again, about 60 times a second by default, which is what makes animation possible. frameCount counts how many times draw() has run.
Mapping data to the screen. The key function is map(value, inLow, inHigh, outLow, outHigh), which converts a number from one range to another. Suppose the canvas is 300 pixels tall and heart rates from 40 to 120 should fill the space between y = 270 (bottom) and y = 30 (top). For 72 bpm, map(72, 40, 120, 270, 30) works out the fraction (72 − 40) ÷ (120 − 40) = 0.4 of the way, then moves 0.4 of the 240-pixel range upward from 270: 270 − 96 = 174. So 72 bpm is drawn at y = 174. The screen’s y-axis points down, which is why the higher heart rate gets the smaller y.
A starter sketch. Each reading becomes a circle that pulses at its own rate. One beat per second at 60 bpm means a pulse of bpm / 60 beats per second, so the circle’s size follows sin(TWO_PI * (bpm / 60) * t), where t is time in seconds.
// Illustrative data: invented for teaching, not a real patient
let bpm = [72, 74, 71, 73, 75, 72, 70, 96, 98, 74, 73, 72];

function setup() {
  createCanvas(480, 300);
}

function draw() {
  background(250);
  let t = frameCount / 60;            // seconds, at 60 frames per second
  stroke(200);
  let y60 = map(60, 40, 120, 270, 30);
  let y100 = map(100, 40, 120, 270, 30);
  line(40, y60, width - 20, y60);     // guide lines for 60 and 100 bpm
  line(40, y100, width - 20, y100);
  noStroke();
  for (let i = 0; i < bpm.length; i++) {
    let x = map(i, 0, bpm.length - 1, 60, width - 40);
    let y = map(bpm[i], 40, 120, 270, 30);
    let r = 8 + 3 * sin(TWO_PI * (bpm[i] / 60) * t);
    fill(40, 90, 160);
    circle(x, y, r * 2);
  }
}
Design decisions are data decisions. Position shows the value, pulsing speed shows the value again (a redundant encoding, which helps viewers), and color is not yet used. What should color mean? Minutes 8 and 9 are much higher than the rest. Would you highlight them? If you do, you are telling the viewer they matter, so be ready to say why, and to say what you do not know (perhaps the person stood up or climbed stairs). Never label a reading as a disease.
Extending it. Add axis labels with text(), connect the points with lines to show change over time, or use mouseX to reveal the exact value of the nearest reading. Keep a mapping table: data field, visual variable, range, reason.
📖 Read for this lesson
The reading opens over the lesson; close it to come back to exactly where you were. The checks below draw on it.
Studio: Sample heart-rate data and a monitor readout, then code
Question. How can an animated visualization make a series of heart-rate readings readable and expressive without implying a diagnosis?
Materials
- The provided illustrative dataset and the illustrative blood pressure monitor readout (both in the reading for this lesson)
- A clock or phone timer with a seconds display (only for the optional private pulse count)
- Data sheet and pencil
- A computer or tablet with a web browser for the p5.js web editor (no account needed)
- Colored pencils for the paper mapping sketch
- The illustrative dataset is the data for this lab. Counting your own pulse is optional and private: your numbers stay on your own paper and are never submitted or shared, and you never measure anyone else.
- If you do count your own pulse, the light-activity step (one minute of marching in place) is also optional; skip it if you have any heart, breathing or joint condition or feel unwell, and stop if you feel dizzy.
- No reading in this lab is diagnostic. If you are ever worried about your health, talk with a parent or guardian and your own clinician.
- Take a screen break of at least 20 seconds every 20 minutes, looking at something far away, and keep cables off the floor.
Procedure
- Read the illustrative blood pressure monitor readout in this lesson’s reading. Label each number it shows (systolic, diastolic, pulse) and say in one sentence why a single reading never makes a diagnosis.
- Load the illustrative dataset and complete the data table below. Optional and private: if you want to feel the rhythm the sketch will show, sit quietly for two minutes, count your own pulse for 15 seconds and multiply by 4; keep the number to yourself.
- Before coding, sketch the visualization on paper and fill in a mapping table: which data value goes to position, size, speed and color, and why.
- Open the p5.js web editor (the link is beside the activity), paste the starter sketch and run it.
- Make at least two deliberate changes: for example, connect the points, add axis labels, use color for the two high readings, or show the exact value when the mouse is near.
- Save screenshots at three stages of development and download the sketch.
Data
| Reading (illustrative dataset) | Beats per minute | y = map(bpm, 40, 120, 270, 30) | Pulses per second (bpm ÷ 60) |
|---|---|---|---|
| 1 | 72 | ||
| 7 | 70 | ||
| 8 | 96 | ||
| 9 | 98 |
Analysis
- Explain one data-to-visual mapping in your sketch and why you chose it. Would a viewer read it the way you intended? Come back after a day and look at it fresh, or ask a family member or other adult (optional) what they see first, without explaining.
- What happens at minutes 8 and 9 in the illustrative data? How did you show it, and how did you avoid implying something is wrong?
- Name two sources of error in counting a pulse for 15 seconds and multiplying by 4.
- What feeling does your animation create, and is that feeling honest to the data?
If you cannot do this studio in person: If the web editor or a computer is not available, use the illustrative dataset and draw the visualization as a flip-book or a sequence of six frames on paper, showing the circles pulsing at their rates (the reading for this lesson gives the computed sizes).
Formative check
Work through these before moving on. They are not graded — they tell you whether the standard below has landed yet.
With the canvas mapping map(bpm, 40, 120, 270, 30), where is 100 bpm drawn?
In the starter sketch, how fast does the circle for 72 bpm pulse compared with the circle for 96 bpm?
Coloring the two high readings red and labeling them ‘abnormal heart’ is an accurate design choice for the illustrative dataset.
Simulation & tools
Code your heart-rate visualization
Open the p5.js web editor (no sign-in needed). Paste the starter sketch from the lesson and press Play. Record what you see. Then (1) change the color so readings above 90 bpm use a second color and write down why that threshold; (2) add text(bpm[i], x - 8, y - 14); inside the loop to label each circle; (3) use stroke() and line() to connect neighboring points. Answer: which change most improved what a viewer can learn, and why? Download the sketch with File > Download. Without a computer, complete the paper mapping sketch and six-frame flip-book.
Open p5.js Web Editor ↗ · p5.js Web Editor, Processing Foundation · LGPL-2.1 open source
How confident are you that you can work with heart-rate data responsibly and code a visualization with deliberate data mappings?
Practice
Work these on paper or in your notebook, then open Check your answer. Aim for all of Fluency and Application; try at least one Challenge.
Printable version: this unit’s practice workbook (PDF)
Fluency
Build speed and accuracy with the core skill.
- In p5.js, what does setup() do, what does draw() do, and what does frameCount count?
Check your answer
Answer: setup() runs once and creates the canvas. draw() runs again and again, about 60 times a second by default, which makes animation possible. frameCount counts how many times draw() has run.In the starter sketch, t = frameCount / 60 turns frames into seconds. - Define redundant encoding and say which two visual variables encode heart rate in the starter sketch.
Check your answer
Answer: Showing the same data value with two visual variables to make it easier to read. In the starter sketch, position (y) and pulsing speed both show the heart rate.Color is not yet used; deciding what it means is a design decision. - Compute pulses per second (bpm / 60) for 72, 96 and 98 bpm, to two decimal places.
Check your answer
Answer: 72: 1.20; 96: 1.60; 98: 1.63.72 / 60 = 1.2; 96 / 60 = 1.6; 98 / 60 = 1.633, which rounds to 1.63.
Application
Use the skill in context. Show your reasoning.
- Using map(bpm, 40, 120, 270, 30), compute y for 70, 96 and 98 bpm. Show the fraction for each.
Check your answer
Answer: 70 bpm: y = 180. 96 bpm: y = 102. 98 bpm: y = 96.70: (70 – 40) / 80 = 0.375; 0.375 x 240 = 90; 270 – 90 = 180. 96: 56 / 80 = 0.7; 0.7 x 240 = 168; 270 – 168 = 102. 98: 58 / 80 = 0.725; 0.725 x 240 = 174; 270 – 174 = 96. - The starter sketch draws guide lines at 60 and 100 bpm. At what y values are they drawn? Why does the higher rate get the smaller y?
Check your answer
Answer: 60 bpm at y = 210; 100 bpm at y = 90. The screen’s y-axis points down, so higher values are drawn nearer the top, which has smaller y.60: 20 / 80 = 0.25; 0.25 x 240 = 60; 270 – 60 = 210. 100: 60 / 80 = 0.75; 0.75 x 240 = 180; 270 – 180 = 90. - Find the mean and the median of the twelve illustrative readings: 72, 74, 71, 73, 75, 72, 70, 96, 98, 74, 73, 72. Which is more affected by minutes 8 and 9?
Check your answer
Answer: Mean about 76.7 bpm; median 73 bpm. The mean is pulled up by the two high readings; the median barely moves.Sum = 920; 920 / 12 = 76.67. Sorted: 70, 71, 72, 72, 72, 73, 73, 74, 74, 75, 96, 98; the middle two are 73 and 73, so the median is 73. The data is invented for teaching. - Complete a mapping table for a design that adds color: fill in data field, visual variable, range and reason for (a) position, (b) pulse speed, (c) color for readings above 90 bpm.
Check your answer
Answer: Model: (a) bpm, y position, 40-120 bpm mapped to y 270-30, so value can be read against guide lines. (b) bpm, pulse speed, bpm / 60 pulses per second, so the rhythm is felt as well as seen. (c) bpm above 90, second fill color, two colors only, to draw attention to the rise at minutes 8 and 9 without labeling it as a disease.A strong answer gives a reason for the threshold and keeps the label neutral; highlighting is a claim, so say what you do not know (perhaps the person stood up or climbed stairs). - A classmate labels the two high readings ‘abnormal heart’ in red. Write a better label and explain why yours is more honest.
Check your answer
Answer: Model: ‘Higher readings at minutes 8-9 (cause unknown; the person may have moved).’ The data cannot support a diagnosis, and the dataset is invented; the label should describe what the data shows, not name a disease.Never label a reading as a disease.
Challenge
Stretch problems. Expect to think before you write.
- In the starter sketch, r = 8 + 3 * sin(TWO_PI * (bpm / 60) * t). What are the smallest and largest radius, and the smallest and largest circle diameter drawn? How many full pulses does the 96 bpm circle make in 5 seconds?
Check your answer
Answer: Radius from 5 to 11; diameter from 10 to 22 pixels. 8 pulses in 5 seconds.sin ranges from -1 to 1, so r ranges from 8 – 3 = 5 to 8 + 3 = 11; circle() takes r x 2, giving 10 to 22. 96 / 60 = 1.6 pulses per second; 1.6 x 5 = 8.
Review
Keep earlier skills sharp.
- Review 1.1: Which of the three design moves from Unit 1 does a mapping table make explicit, and what is the rule for it?
Check your answer
Answer: Encoding: each visual variable (position, size, speed, color) stands for one piece of data, consistently.The mapping table records data field, visual variable, range and reason.
Pulse to Pixels on Paper: Function Reference, Computed Positions, a Six-Frame Flip-Book and Code Extensions
SLS original technique sheet computed from the lesson’s invented 12-reading heart-rate data set; p5.js (Processing Foundation) is named as an optional tool only; normal-range statement from MedlinePlus Medical Encyclopedia, Vital signs (002341); retrieved Sept. 26, 2026 · SLS original
Why this reading. The lab sends you to a web editor to paste and run a sketch. The editor is a tool, and it stays linked beside the activity. But everything the task asks you to reason about is printed here so that you can do the lab with pencil and paper if the editor, the network or a computer is not available: a plain-language reference for every function in the starter sketch, the computed position and speed of all twelve circles, a six-frame flip-book you can draw, the extensions with code, and a mapping table with worked rows. All numbers are computed from the lesson’s invented dataset; the sketch code below is an SLS original extension of the lesson’s starter sketch.
What each function does (plain language)
setup()runs once when the sketch starts.createCanvas(480, 300)makes a drawing area 480 pixels wide and 300 tall.draw()runs again and again, about 60 times a second by default, so anything that depends onframeCountchanges over time.frameCountis the number of timesdraw()has run;frameCount / 60is seconds.map(v, a, b, c, d)converts v from the range a–b into the range c–d in proportion. Example from the lesson:map(72, 40, 120, 270, 30)takes the fraction (72−40)÷(120−40) = 0.4 and moves 0.4 of the 240-pixel span up from 270, giving 174.sin(x)gives a number that swings between −1 and 1 as x increases.TWO_PIis one full turn (about 6.283), sosin(TWO_PI * f * t)completes f swings each second.background()paints the canvas.stroke()/noStroke()set or remove the outline color;fill()sets the inside color;line(x1, y1, x2, y2)draws a line;circle(x, y, d)draws a circle at (x, y) with diameter d;text(s, x, y)writes s. The y-axis points down: y = 0 is the top.
The starter sketch, computed for all twelve readings
In the sketch, x for reading i is map(i, 0, 11, 60, 440), that is 60 + 380×i÷11; y is map(bpm, 40, 120, 270, 30), that is 270 − 3×(bpm − 40) because 240 pixels cover 80 bpm; the circle’s radius is 8 + 3×sin(2π × (bpm÷60) × t), so it swings between 5 and 11 pixels. The two guide lines are at y = 210 (60 bpm) and y = 90 (100 bpm).
| Reading | bpm | x = 60 + 34.5×index (px) | y = 270 − 3×(bpm − 40) (px) | Pulses per second (bpm ÷ 60) | Milliseconds per pulse |
|---|---|---|---|---|---|
| 1 | 72 | 60.0 | 174 | 1.20 | 833 |
| 2 | 74 | 94.5 | 168 | 1.23 | 811 |
| 3 | 71 | 129.1 | 177 | 1.18 | 845 |
| 4 | 73 | 163.6 | 171 | 1.22 | 822 |
| 5 | 75 | 198.2 | 165 | 1.25 | 800 |
| 6 | 72 | 232.7 | 174 | 1.20 | 833 |
| 7 | 70 | 267.3 | 180 | 1.17 | 857 |
| 8 | 96 | 301.8 | 102 | 1.60 | 625 |
| 9 | 98 | 336.4 | 96 | 1.63 | 612 |
| 10 | 74 | 370.9 | 168 | 1.23 | 811 |
| 11 | 73 | 405.5 | 171 | 1.22 | 822 |
| 12 | 72 | 440.0 | 174 | 1.20 | 833 |
Readings 8 and 9 (96 and 98 bpm) sit at y = 102 and y = 96, just under the 100 bpm guide line at y = 90; their circles pulse at 1.60 and 1.63 times per second while the others pulse at about 1.2. Nothing in the data says why: a person who stood up or climbed stairs would show the same jump. The dataset is invented, so there is no diagnosis to make.
Six-frame flip-book (paper route)
Draw the circle for reading 1 (72 bpm) six times, one per frame, with the radius below (radius in pixels; use 1 pixel = 1 mm on the page, so the diameters are in millimeters). The six frames cover one beat, 60 ÷ 72 = 0.833 s, so each frame is 0.139 s apart. Then flip.
| Frame | Phase of the beat | Radius r = 8 + 3 sin(2π×phase) | Diameter (px) |
|---|---|---|---|
| 1 | 0/6 | 8.0 | 16.0 |
| 2 | 1/6 | 10.6 | 21.2 |
| 3 | 2/6 | 10.6 | 21.2 |
| 4 | 3/6 | 8.0 | 16.0 |
| 5 | 4/6 | 5.4 | 10.8 |
| 6 | 5/6 | 5.4 | 10.8 |
For the 96 bpm circle, one beat takes 0.625 s, so the same six frames are 0.104 s apart: a faster flip. Drawing both flip-books side by side and flipping at the same speed shows the difference in rate.
Extensions, with code (SLS original)
1. A second color above 90 bpm. Replace fill(40, 90, 160); with if (bpm[i] > 90) { fill(200, 90, 20); } else { fill(40, 90, 160); }. Write down why 90 (the two high readings are 96 and 98 and the others are 70 to 75), and a label such as “above 90 bpm” in the sketch, not “abnormal.”
2. A label on each circle. Inside the loop, after circle(...): fill(60); text(bpm[i], x - 8, y - 14);
3. Connect the points. Before the loop: stroke(120); noFill(); beginShape(); for (let i = 0; i < bpm.length; i++) { vertex(map(i, 0, bpm.length - 1, 60, width - 40), map(bpm[i], 40, 120, 270, 30)); } endShape(); noStroke();
4. Reveal a value by mouse. Inside the loop: if (dist(mouseX, mouseY, x, y) < 15) { fill(0); text(bpm[i] + " bpm", x + 12, y); } (dist gives the distance between two points).
Which change most improved what a viewer can learn? A good answer names what the viewer can now do that they could not before (for example, read an exact value, or see the order in time) and notes any new claim the change makes.
A mapping table, with worked rows
| Data field | Visual variable | Range | Reason |
|---|---|---|---|
| Heart rate (bpm) | Vertical position | 40–120 bpm to y = 270–30 px | Position is the easiest variable to compare; higher rate is higher on the page |
| Heart rate (bpm) | Pulse speed | bpm ÷ 60 pulses per second | Rate is redundantly encoded as a rhythm, so the picture beats at the rate it shows |
| Reading number (time order) | Horizontal position | 0–11 to x = 60–440 px | Left to right is earlier to later |
| Above 90 bpm (added) | Color: orange or blue | Two values | Only marks a threshold I chose; no diagnostic meaning |
The blood-pressure demonstration, as an illustrative readout
The lab has you record what an automatic cuff displays without recording who it was taken from. If a monitor is not available, use this invented readout, marked illustrative (invented for teaching, not a real patient): systolic 118, diastolic 76, pulse 74 beats per minute. In the same notation the lesson uses, 118 is the pressure when the heart beats and 76 is the pressure between beats, both in mm Hg. MedlinePlus gives a normal resting adult range of 90/60 to 120/80, so this readout falls inside it; one reading still makes no diagnosis.
Sources: p5.js web editor (optional tool, Processing Foundation) (editor.p5js.org); MedlinePlus, Vital signs (medlineplus.gov)