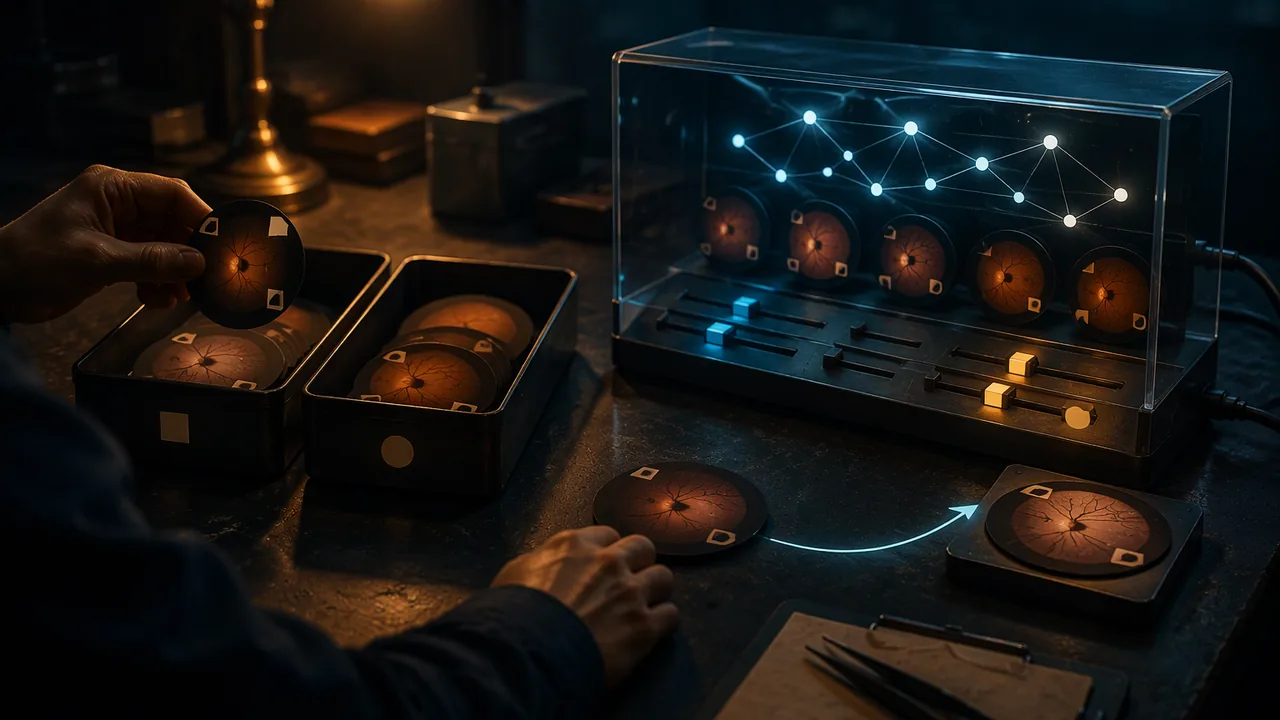
produce, revise and present an accurate explanatory infographic and storyboard that teaches how a supervised medical image classifier learns.
Instruction
This task brings the unit together. You will teach a ninth-grade audience how a supervised classifier learns to sort medical images, using a single-page infographic and a twelve-frame storyboard for a short motion piece. You are judged on two things at once: whether the science is right, and whether your design choices make it understandable.
What the piece must show. Labeled training examples, and who labels them (in medicine, usually trained clinicians). Features: what the model measures or learns to notice. Training: the model adjusting until its outputs match the labels. Testing on unseen examples. At least one way the model can be wrong, such as a shortcut feature, unrepresentative training data or overfitting. Use a medical example you can describe accurately, such as the course’s sickle-cell cards or a retinal-photograph screening tool, and do not claim anything about a real product that you have not checked in its FDA summary or a reliable source.
The design statement. In about 600 words, explain your audience, your one-sentence takeaway, your visual system (type, palette, icons, sequence) and why each choice serves the audience. Cite at least one design study from Lesson 1.1 and say what you borrowed. Name your sources, including OpenStax for any biology. AI imagery is never required. If you used any AI-generated element (only with a parent’s or guardian’s permission, in a tool that needs no account and allows your age), say exactly which parts it produced and how you selected, arranged or changed them.
How it is scored. The rubric weights accuracy and design equally. A beautiful piece with a wrong claim is not proficient; neither is a correct piece nobody can follow. Advanced work shows a clear personal visual idea, a sequence that anticipates the audience’s questions, and honest imagery throughout.
The four stages. Stage 1 is a plan: takeaway, thumbnails, storyboard frames 1-6 and a fact list with sources. Stage 2 is a full draft that you set aside for at least a day and then critique yourself with the Lesson 1.3 protocol and the self-critique sheet in this lesson’s reading (a family member or other adult may look at it and tell you what they understood; this is optional); you submit your notes and a revision plan. Stage 3 is the revised final with the design statement. Stage 4 is a three-minute recorded walkthrough, followed on the same recording by your answers to the two published questions: “Where does your piece show the program being tested on examples it never trained on, and what would go wrong if that step were skipped?” and “What is the largest thing on your page, and why did it earn that size?”
Tools. Paper, pencil and markers are fully acceptable; photograph or scan the final at good resolution. Free tools such as Inkscape, Krita or GIMP work well for layout. No account or purchased software is required.
📖 Read for this lesson
The reading opens over the lesson; close it to come back to exactly where you were. The checks below draw on it.
Formative check
Work through these before moving on. They are not graded — they tell you whether the standard below has landed yet.
Which element is required in the explainer but most often left out?
A visually striking explainer with one incorrect claim about how training works can still score proficient.
How confident are you that you can produce and present an accurate, well-designed explainer of how a medical image classifier learns?
Unit 1 checkpoint
Do this before you start the task. It covers the whole unit and tells you what to review first.
In Minard’s map of Napoleon’s 1812 campaign, what does the width of the band stand for?
Some AI systems in use in hospitals today are artificial general intelligence.
In Isotype, one symbol always stands for a fixed .
A drawn cell is 12 mm long and 10 mm wide. With the rule ‘if ratio > 2.0, label sickle’, what is predicted?
Labeled examples held back from training to measure performance on unseen data form the set.
If every sickle card in the training set is drawn in red, a model may learn color instead of shape.
Which description fits unsupervised learning?
Which critique step comes directly after Describe?
An explainer whose sentences are all true cannot mislead its audience.
Using the illustrative model heart rate = 80.2 – 0.25 x minutes, what is predicted for 12 minutes of walking?
A small, fast sketch used to compare layout options is a .
Submit: explainer infographic + 12-frame storyboard + 600-word design statement + 3-minute walkthrough
Task: Teach a ninth-grade audience how a supervised classifier learns to sort medical images. Show labeled training data, features, training, testing on unseen examples and at least one source of error. Your design statement explains your audience, takeaway, visual system and sources, and discloses any AI-generated elements and what you did with them.
Submission workflow
- Stage 1 — Plan. One-sentence takeaway, three thumbnails with your choice explained, storyboard frames 1-6 and a fact list with a source for each fact.
- Stage 2 — Self-critiqued draft. Complete draft of both pieces, set aside for at least a day, then critiqued by you with the describe-analyze-interpret-evaluate protocol and the self-critique sheet (an optional family member or other adult viewer may add notes); submit your notes and your revision plan.
- Stage 3 — Revised final. Final infographic, all twelve frames and the 600-word design statement.
- Stage 4 — Walkthrough. Three-minute recorded presentation, then answer the two published questions on accuracy and design on the same recording.
How it is scored
| Criterion | What proficient looks like |
|---|---|
| Production and aesthetic choices (MA:Cr3A.I) | Content, technique and style are deliberately chosen and consistent; hierarchy and palette serve the takeaway. |
| Accuracy of the AI content (WHST.11-12.2) | Training data, features, training, testing and a source of error are all shown correctly, with uncertain points marked. |
| Integration of art and content (MA:Pr4A.I) | Image, text and sequence work as one unified explanation designed for the stated audience. |
| Presentation design (MA:Pr6A.I, SL.11-12.5) | Walkthrough uses the work itself to guide the viewer and answers the published questions accurately. |
| Response to critique (MA:Re9A.I) | Revision plan and final show specific changes made in response to criteria-based self-critique (and any viewer’s notes). |
Portfolio Brief: The Classifier Explainer, with Facts, Rubric Levels, an Exemplar and a Self-Critique Sheet
SLS original brief and constructed exemplar; regulatory facts from FDA De Novo Classification Request for IDx-DR (DEN180001), accessdata.fda.gov, retrieved Sept. 26, 2026; NHLBI, Sickle Cell Disease page, retrieved Sept. 26, 2026 · SLS original, quoting public-domain U.S. government documents
Why this reading. This is the complete brief for the portfolio task: the facts you may build on, what each rubric level looks like, a constructed exemplar with an explanation of why it is strong, the self-critique sheet and the two published walkthrough questions. You need nothing else to complete the task. The exemplar is an SLS original written for this course; it is not a student’s work and not a real product’s claims. The regulatory facts are quoted from the FDA’s public decision summary.
The assignment in one paragraph
Teach a ninth-grade audience how a supervised classifier learns to sort medical images, using one single-page infographic and a twelve-frame storyboard for a 60 to 90 second motion piece. Both must show: labeled training examples and who labeled them; features; training; testing on examples the program has not seen; and at least one way it can be wrong. Then write a design statement of about 600 words and give a three-minute walkthrough.
Fact base 1: a real screening device (FDA De Novo summary DEN180001, IDx-DR)
You may use these facts, all from the FDA’s public decision summary for IDx-DR (De Novo request dated January 12, 2018; regulation 21 CFR 886.1100; class II; retrieved 26 September 2026). Say “granted De Novo classification” or “authorized for marketing.” Do not say “FDA approved.”
- What it is for. To automatically detect more than mild diabetic retinopathy (called mtmDR) in adults diagnosed with diabetes who have not been previously diagnosed with diabetic retinopathy, using the Topcon NW400 camera. It “is not intended to detect concomitant diseases.” It is prescription-only.
- How it was tested. A pivotal study with 900 participants enrolled at 10 primary care sites. Camera operators had never done eye imaging before and got one four-hour training. The same participants were also imaged by a certified professional photographer using a different camera. Those images went to a reading center, where three experienced readers graded them and the majority decided; that grade was the reference standard (the “labels”).
- What the summary does not tell you. It describes the testing and operator training. It does not give the details of the data the algorithm learned from, so do not invent them. If your infographic shows “the labeled examples,” make clear it is a generic illustration of how such a program is trained.
| Reading center: disease (mtmDR+) | Reading center: no disease (mtmDR−) | Total | |
|---|---|---|---|
| Device said: disease detected | 173 | 65 | 238 |
| Device said: not detected | 25 | 556 | 581 |
| Total | 198 | 621 | 819 |
Of 900 enrolled, 819 could be fully analyzed by the device and the reading center (an analyzable fraction of 92%); the table covers those 819. The cells 173, 556, 198, 621, 238 and 581 are printed in the summary; the two counts 25 and 65 are my subtractions: 198 − 173 = 25 and 238 − 173 = 65. The calculations to show or to avoid misusing: sensitivity = 173 ÷ 198 = 87.4% (the share of people who had the disease that the device flagged); specificity = 556 ÷ 621 = 89.5% (the share of people without it that the device cleared); positive predictive value = 173 ÷ 238 = 72.7% (of everyone flagged, the share who had it); negative predictive value = 556 ÷ 581 = 95.7%. So 27 of every 100 people flagged did not have more-than-mild disease in this study, and 25 people who had it were not flagged. The study enrolled some participants selected for higher blood-sugar levels, so these numbers are not the rate you would see in every clinic; the summary says so and gives “enrichment-corrected” values too.
Fact base 2: the course’s cell cards
If you prefer the sickle-cell example, use the forty measured cards in the reading “Forty Measured Cell Cards,” and this fact from the National Heart, Lung, and Blood Institute: sickle cell disease is a group of inherited disorders that affect hemoglobin, the major protein that carries oxygen in red blood cells; the red cells can become crescent- or sickle-shaped, and then “do not bend or move easily and can block blood flow” (retrieved 26 September 2026 from nhlbi.nih.gov). Any biology beyond that needs your own named source from NIH, MedlinePlus or another federal site.
What each level looks like
| Criterion | Not yet | Proficient | Advanced |
|---|---|---|---|
| Production and aesthetic choices | Several type sizes and colors with no pattern; the main idea is not the largest thing | One takeaway sentence; hierarchy, palette and type follow the technique sheet; each color has one meaning | A recognizable personal visual idea that also carries the takeaway |
| Accuracy of the AI content | A required element is missing or wrong (for example, testing on the same examples it trained on) | All five elements correct, with at least one source of error and uncertain points marked | Also distinguishes what the tool was tested on from what it is used for; numbers defined, not just quoted |
| Integration of art and content | Pictures decorate text | Image, text and sequence tell one explanation for the stated audience | Sequence anticipates the audience’s next question |
| Presentation design | Reads the slides aloud | Uses the work itself to walk the audience through it; answers two questions accurately | Answers a hard question by pointing to the evidence in the work |
| Response to critique | Revision plan lists no changes | At least three specific changes traced to the self-critique sheet (or a viewer’s notes) | Explains a comment declined, with a reason |
A constructed exemplar (SLS original)
Takeaway sentence. “A screening program learns from eye photographs that experts have already graded, then is tested on photographs it has never seen; it can only be trusted for the kind of patient and the one disease it was tested on.”
Infographic, described. Letter portrait. Title band in navy: the takeaway, 30-point. Working band, three panels top to bottom joined by arrows: (1) “Graded examples,” six small retinal drawings, three with an orange border for “grader marked: disease”; (2) “Training,” the same drawings with a teal dial that moves until the program’s guess matches the orange marks; (3) “Testing,” a fresh set of four drawings, hidden until now, with a small table of two counts: found, missed. A strip across the bottom, 14-point, reads “Limits: one disease. Adults with diabetes. Tested at 10 clinics. Not tested on everyone.” Source line at 10-point, dark gray (#1F2A44 on white, contrast 14.3:1): FDA De Novo summary DEN180001.
Storyboard, frames 1 to 12, one line each. 1 A grader marks a photograph. 2 Twenty photographs, each with a mark. 3 Cards split into two piles, TRAIN and TEST. 4 A ruler measures a shape (a feature). 5 A dial turns as guesses improve. 6 The dial stops. 7 A new photograph appears, marked with a question. 8 The program guesses in teal. 9 A tally: found 7, missed 1 (invented). 10 A photograph of a very different patient group is grayed out: “not tested here.” 11 Text: “Only as good as the examples.” 12 The takeaway sentence.
Excerpt from the design statement (about 140 of 600 words). “My audience is ninth graders who have heard that AI ‘thinks.’ My takeaway is a sentence about learning from graded examples, because Nightingale’s diagram in Lesson 1.1 taught me that the largest thing on the page should be the argument. I borrowed her one-job-per-color habit: orange means a grader’s mark and teal means the program’s output, and no other text uses either. I rejected a glowing brain because the FDA’s summary describes a device that detects one disease with one camera, and a brain suggests general intelligence. I checked each number against the FDA summary; I say ‘detected 173 of 198 people who had the disease,’ not ‘87% accurate,’ because accuracy hides two kinds of mistake. I used no AI image tool; the drawings are mine.”
Why this is strong. One sentence controls the page. Each required element has a named place (the frame numbers show it). The limits appear in the finished piece, not only in the notes. The statement names a design choice, a source it borrowed from, a rejected alternative and the reason. Every number is traceable, and it says how AI tools were or were not used.
Self-critique sheet (fill it in after at least a day away from the draft)
You are your own reviewer. If a family member or other adult is willing to look at the draft, ask them to answer steps 1 and 3 aloud while you write down what they say; this is optional.
- Describe (no judgment): list what is on the page and in which order you looked at it.
- Analyze: what is largest? what is each color used for? are any two things using the same color for different jobs?
- Interpret: after one fresh look (or from what your viewer said), what does the piece say the program does? what did the piece want you to feel about it?
- Evaluate, criterion by criterion: for Accuracy, tick which of the five elements you could find (labeled examples and who labeled them / features / training / testing on unseen examples / a way it can be wrong) and name any claim you doubt; for Clarity, retell the explanation in two sentences; for Honest imagery, name any picture that suggests more than the method does.
- Two specific suggestions. Each must say what to change, where, and why.
Revision plan format. A table with three columns: critique note (from your sheet or a viewer), change I will make (or reason I will not), and where the change appears in the final. At least three rows.
Walkthrough, three minutes
0:00–0:30 the takeaway sentence and the audience. 0:30–1:45 walk the infographic top to bottom, pointing. 1:45–2:30 play or narrate the storyboard’s twelve frames. 2:30–3:00 one thing you changed after critique. Then answer the two published questions below.
The two published questions (answer both on the same recording, after the walkthrough): (1) Accuracy: “Where does your piece show the program being tested on examples it never trained on, and what would go wrong if that step were skipped?” (2) Design: “What is the largest thing on your page, and why did it earn that size?”
Sources: FDA De Novo decision summary DEN180001 (IDx-DR) (accessdata.fda.gov); NHLBI, Sickle Cell Disease (nhlbi.nih.gov)