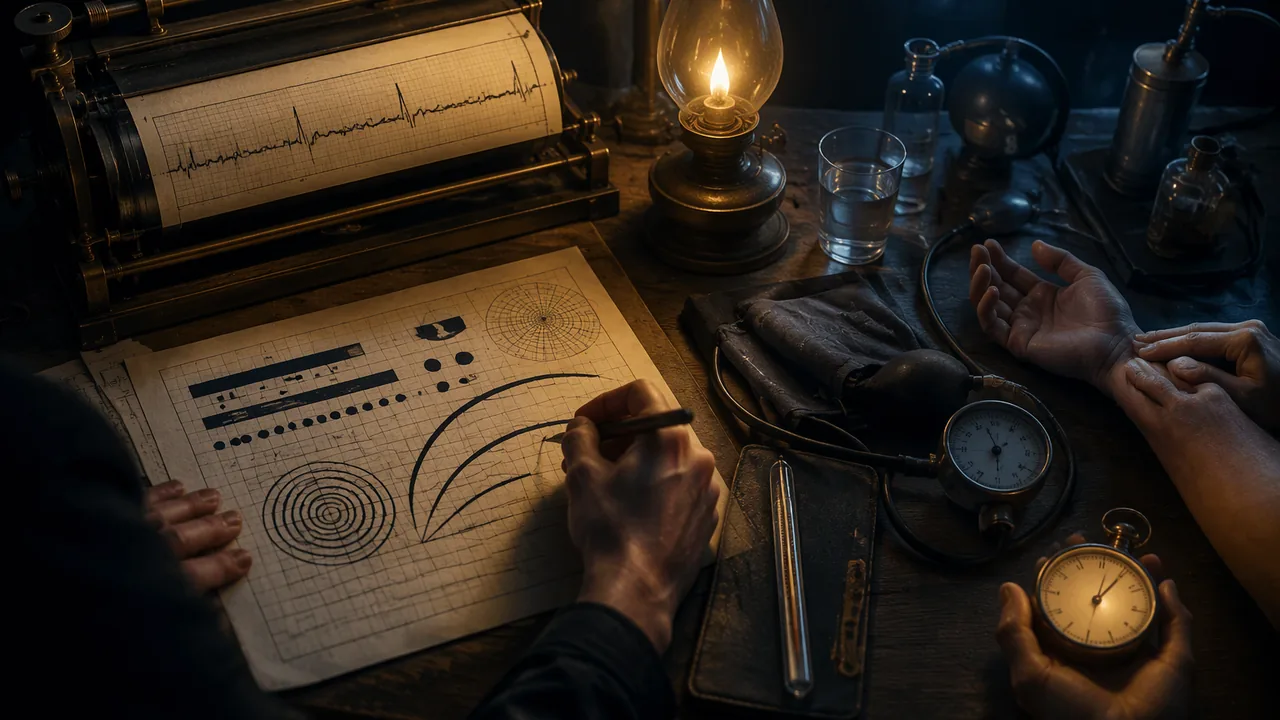
analyze how data visualizations carry meaning, emotion and argument in their contexts, and describe the vital signs and how each is measured.
Instruction
Data does not speak for itself. Someone decides what to measure, how to draw it and for whom. This lesson looks at two very different moments when data became image, and then at the body’s own data: the vital signs.
W. E. B. Du Bois and the 1900 Paris Exposition. For the Exhibit of American Negroes at the 1900 Paris Exposition, the sociologist W. E. B. Du Bois and a team of students and alumni at Atlanta University hand-drew dozens of color charts about the lives of Black Americans, especially in Georgia: population, land ownership, occupations, literacy, income. The originals are held by the Library of Congress. The charts use bold color blocks, spirals and unusual shapes, some bending bars into curves when they run out of space. The design had a purpose: to show a European audience, a generation after emancipation, the progress Black Americans had made in spite of discrimination, using evidence. Du Bois’s charts show that a visualization can be precise and still have a strong visual voice and a clear argument.
Willem Einthoven and the electrocardiogram. In the early 1900s the Dutch physiologist Willem Einthoven used a very sensitive instrument, the string galvanometer, to record the tiny electrical signals of the heart as a trace on photographic film. He named the waves P, Q, R, S and T, names still used on every electrocardiogram (ECG). He received the Nobel Prize in Physiology or Medicine in 1924. The ECG trace became one of the most recognizable images in medicine; in films and logos a spiking line means “alive”. It is a case of a scientific graph becoming a cultural symbol.
The vital signs. Clinicians routinely measure four vital signs: body temperature, pulse (heart rate), respiratory rate (breaths per minute) and blood pressure; many settings also measure blood-oxygen saturation with a pulse oximeter. MedlinePlus gives the normal resting heart rate for adults as 60 to 100 beats per minute. Blood pressure is written as two numbers in millimeters of mercury (mm Hg): systolic, the pressure when the heart beats, over diastolic, the pressure when it rests between beats. For adults, a reading below 120/80 mm Hg is considered normal by the NIH and the American Heart Association. Values vary with age, activity, emotion and measurement technique, which is why one reading never makes a diagnosis.
Measuring a pulse. Place two fingers (not the thumb, which has its own pulse) on the inside of the wrist below the thumb or at the side of the neck, count beats for 15 seconds and multiply by 4. If you count 18 beats in 15 seconds, the rate is 72 beats per minute. Counting your own pulse is optional in this course, and the number stays with you; you never need to record or share it.
Questions to ask of any data image. Who collected the data, and why? Who is the audience? What is emphasized, and what is left out? What feeling does the design create, and is that feeling supported by the data? Next lesson you will make your own.
📖 Read for this lesson
The reading opens over the lesson; close it to come back to exactly where you were. The checks below draw on it.
Formative check
Work through these before moving on. They are not graded — they tell you whether the standard below has landed yet.
You count 21 beats in 15 seconds. What is the heart rate?
Du Bois’s 1900 charts were designed to present evidence of Black Americans’ progress to an international audience.
In a blood pressure reading of 118/76 mm Hg, 118 is the pressure and 76 is the pressure.
Choose one Du Bois chart from the Library of Congress collection. Describe its data, its most striking design choice and the argument that choice supports. Then say what feeling the ECG trace carries as a cultural symbol and whether that feeling matches what an ECG measures.
How confident are you that you can analyze data visualizations in their contexts and describe the vital signs and how they are measured?
Practice
Work these on paper or in your notebook, then open Check your answer. Aim for all of Fluency and Application; try at least one Challenge.
Printable version: this unit’s practice workbook (PDF)
Fluency
Build speed and accuracy with the core skill.
- Name the four routine vital signs, and the extra measurement many settings also take.
Check your answer
Answer: Body temperature, pulse (heart rate), respiratory rate (breaths per minute) and blood pressure. Many settings also measure blood-oxygen saturation with a pulse oximeter.Values vary with age, activity, emotion and measurement technique, which is why one reading never makes a diagnosis. - An invented example person, Sam, has a blood pressure reading of 116/74 mm Hg. Which number is systolic, which is diastolic, and what does each measure?
Check your answer
Answer: 116 is systolic, the pressure in the arteries when the heart beats. 74 is diastolic, the pressure when the heart rests between beats.The first number is systolic, the second diastolic, both in millimeters of mercury. - Who was Willem Einthoven, what letters did he give the ECG waves, and when did he receive the Nobel Prize?
Check your answer
Answer: A Dutch physiologist who, in the early 1900s, recorded the heart’s electrical signals with a string galvanometer on photographic film. He named the waves P, Q, R, S and T, and received the Nobel Prize in Physiology or Medicine in 1924.The ECG trace later became a cultural symbol meaning ‘alive’.
Application
Use the skill in context. Show your reasoning.
- Using the lesson’s method (count for 15 seconds, multiply by 4), find the heart rate for invented example people who count (a) 18 beats, (b) 16 beats, (c) 25 beats. Which fall within the adult resting range MedlinePlus gives?
Check your answer
Answer: (a) 72 bpm; (b) 64 bpm; (c) 100 bpm. All three fall within 60 to 100 bpm (100 is at the top of the range).18 x 4 = 72; 16 x 4 = 64; 25 x 4 = 100. Remember that one reading never makes a diagnosis. - Why does the lesson say to use two fingers and not the thumb when counting a pulse? Name the two places it gives for finding a pulse.
Check your answer
Answer: The thumb has its own pulse, which would be counted by mistake. The inside of the wrist below the thumb, or the side of the neck.Counting for 15 seconds and multiplying by 4 is the method; small counting errors are multiplied by 4 too. - Apply the lesson’s four questions for any data image to Du Bois’s 1900 charts: who collected the data and why, who was the audience, what was emphasized, and what feeling the design creates.
Check your answer
Answer: Du Bois and a team of students and alumni at Atlanta University made the charts for the Exhibit of American Negroes at the 1900 Paris Exposition, to present evidence of Black Americans’ progress. The audience was a European one, a generation after emancipation. They emphasized population, land ownership, occupations, literacy and income, especially in Georgia. Bold color blocks, spirals and bent bars create a confident, striking voice supported by the evidence.A strong answer connects the design voice to the argument and notes the data supports it. - In films and logos a spiking line means ‘alive’. In 2-3 sentences, explain how the ECG trace became a cultural symbol and whether that symbol matches what an ECG actually measures.
Check your answer
Answer: Model: The ECG trace became one of medicine’s most recognizable images, so popular media borrowed it as shorthand for life. An ECG actually records the heart’s electrical activity as P, Q, R, S and T waves. The symbol is related but simplified: it turns a measurement of electrical signals into a feeling about being alive.A strong answer names what the ECG measures and judges whether the feeling matches the data.
Review
Keep earlier skills sharp.
- Review 2.1: Du Bois’s charts bend bars into curves when they run out of space. Like Priestley’s chart, his charts have a point of view. What does the lesson say every timeline or data image needs that point of view to be?
Check your answer
Answer: Deliberate and honest, supported by the data.Du Bois shows a visualization can be precise and still have a strong voice and a clear argument.
Three Du Bois Data Portraits Described, Einthoven’s ECG, and a Vital-Signs Reference Card
W. E. B. Du Bois, The Georgia Negro drawings for the 1900 Paris Exposition, Library of Congress Prints and Photographs Division, LOT 11931 nos. 25, 14, 11 (LC control nos. 2013650445, 2013650433, 2013650430; LC-DIG-ppmsca-33887, -33876, -33873; no known restrictions on publication); NobelPrize.org, Physiology or Medicine 1924; M. J. Hurst, Naming of the Waves in the ECG, Circulation 98:1937 (1998); MedlinePlus Medical Encyclopedia, Vital signs (002341); all retrieved Sept. 26, 2026 · Public domain (1900 drawings; U.S. government works), with SLS original descriptions and calculations
Why this reading. The open question tells you to choose a Du Bois chart “from the Library of Congress collection” and to say what feeling an ECG carries. Three charts are described here from the Library of Congress digital files, with every printed number read off the drawing, and the ECG is described and its history checked. The vital-sign reference card the output asks for is included with its source. What to look for: the data, the one design choice that stands out, and the argument it supports.
Three charts by W. E. B. Du Bois for the 1900 Paris Exposition
The collection. The Library of Congress Prints and Photographs Division holds the drawings, in LOT 11931, part of the Daniel Murray collection. They were prepared for the Negro Exhibit of the American Section at the 1900 Paris Exposition Universelle to show the economic and social progress of African Americans since emancipation. Each item is a drawing in ink and wash on board, about 710 × 560 mm, and the Library’s rights statement for each is “No known restrictions on publication.” Public domain. The Library says the exhibit was assembled by Du Bois with Thomas J. Calloway, and that both were awarded gold medals. Records and digital files retrieved 26 September 2026.
Chart A. “Assessed value of household and kitchen furniture owned by Georgia Negroes”
Record. LC control no. 2013650445; LOT 11931, no. 25; digital file LC-DIG-ppmsca-33887; the Library describes it as a circular bar graph.
Described. A tall portrait sheet, the title in black capitals across the top. At the upper left a six-line legend gives the year, a line, and a dollar figure: 1875, $21,186; 1880, $498,532; 1885, $736,170; 1890, $1,173,624; 1895, $1,322,694; 1899, $1,434,975. Beside it, six bands of color start together at one point at the top center and sweep clockwise around a common center like a coiled ribbon: pink (1875), a short band that barely begins; blue (1880); brown (1885); yellow (1890); pale gray (1895); crimson (1899). The bands are the same width and their arc length stands for the value. The longer ones (yellow, gray, crimson) go past a full circuit and continue into a smaller inner ring, so the crimson band ends near the middle. There are no axes or gridlines; the numbers are in the legend.
Analysis. Encoding: length along a curve, which is harder to compare than length along a straight line; the drawing pays for its beauty with precision, so the legend carries the exact numbers. Argument: the value grew about 68 times from 1875 to 1899 (1,434,975 ÷ 21,186 = 67.7) and about 2.9 times from 1880 (1,434,975 ÷ 498,532 = 2.88). The 1875 band, almost invisible next to the others, is the design choice that makes the growth felt. What it hides: the numbers are “assessed value,” a tax valuation, not what furniture was worth to its owners, and there is no comparison with white households.
Chart B. “Illiteracy”
Record. LC control no. 2013650433; LOT 11931, no. 14; LC-DIG-ppmsca-33876; the Library: a graph showing the percentage of illiterate African Americans from 1860 to 1900.
Described. A near-empty sheet with the one word “ILLITERACY.” at the top. Five heavy black vertical bars hang from a stair-step of thin horizontal date bars: 1860, 1870, 1880, 1890 and, in parentheses with a question mark, (1900?). Each bar runs down to one common baseline, and under it, after the words “Percent of illiteracy,” is its value: 99%, 92.1%, 81.6%, 67.27% and, in parentheses with a question mark, 50%? The bars get shorter as the years advance; measuring the picture, the lengths are proportional to the percentages to within a few percent.
Analysis. Encoding: bar length equals percent; the staircase of dates encodes time, and the whole thing reads as a set of steps down. Argument: illiteracy fell from 99% in 1860 to 67.27% in 1890, a fall of about 32 percentage points in thirty years. The last bar is drawn to the same rule but with question marks, so the design separates a measured value from a projection. Data limits: the chart has no source line on the drawing itself; the reader has to trust the maker.
Chart C. “City and rural population. 1890.”
Record. LC control no. 2013650430; LOT 11931, no. 11; LC-DIG-ppmsca-33873; the Library: numbers of African Americans in small and large cities compared to rural environments.
Described. A single continuous ribbon, drawn like a line that changes color and direction. It starts at the left as a horizontal green band, “78,139 Negroes in cities of over 10,000 inhabitants”; a short blue band turns down and to the left, “8,025 Negroes in cities from 5,000 to 10,000”; a yellow band runs diagonally down and to the right, “37,699 Negroes in cities from 2,500 to 5,000”; and a long crimson band turns back down and to the left and winds into a tight spiral of four to five turns, with “734,952” at its center and the words “Negroes living in the country and villages” curved along the outside. The four numbers are printed on the sheet, and the colors label the categories.
Analysis. Encoding: length along the ribbon equals count. Argument: the four numbers add to 858,815, and 734,952 of them, 85.6%, lived in the country and villages; the ribbon makes the reader travel a long way to reach the rural number. What it hides: the categories are size classes of place, not people; the chart cannot show why so many lived rurally.
Willem Einthoven and the electrocardiogram
Record. Einthoven (born 21 May 1860, died 29 September 1927), professor of physiology at Leiden, received the 1924 Nobel Prize in Physiology or Medicine “for his discovery of the mechanism of the electrocardiogram” (NobelPrize.org, retrieved 26 September 2026 through a search of its page). He built the string galvanometer in 1903: a fine quartz thread stretched in a magnetic field that moved when the tiny currents of the heart passed through it, with the movement photographed on moving film.
A correction to the lesson. The letters P, Q, R, S, T date from 1895, before the string galvanometer. In an article on the naming of the ECG waves (M. J. Hurst, Circulation 98, 1998, doi 10.1161/01.CIR.98.18.1937), Einthoven used A, B, C, D for the waves on the uncorrected tracing from an early instrument and needed new letters for his mathematically corrected curve, so he chose P through T, possibly following Descartes, who used those letters for successive points on a curve.
What the trace looks like, and how it is read. On standard ECG paper moving at 25 mm per second, each 1 mm small square is 0.04 seconds and each 5 mm large square is 0.2 seconds; vertically, 10 mm is 1 millivolt. A heartbeat draws, in order, a small rounded bump (P), a narrow sharp up-down spike (the QRS complex) and a broader rounded bump (T), then a flat stretch before the next beat. If the spikes are 4 large squares apart, the interval is 4 × 0.2 = 0.8 second, so the rate is 60 ÷ 0.8 = 75 beats per minute, the same as 300 ÷ 4. (These are the standard 25 mm/s calibration values that NIH PubMed Central teaching articles on reading an ECG give; I did not pin them to one article, so confirm them in one before you print them.) What it measures: the electrical activity that spreads through the heart, not the feeling “alive.” A flat line means no electrical signal is being recorded; the cultural meaning is stronger than the measurement.
Vital-sign reference card (source: MedlinePlus Medical Encyclopedia, “Vital signs,” article 002341, retrieved 26 September 2026)
| Vital sign | Normal range for a resting adult | How it is measured |
|---|---|---|
| Body temperature | 97.7°F to 99.1°F (36.5°C to 37.3°C); average 98.6°F (37°C) | A thermometer |
| Pulse (heart rate) | 60 to 100 beats per minute | Two fingers on the wrist or the side of the neck; count for 15 seconds and multiply by 4 (18 beats in 15 seconds is 72) |
| Respiratory rate | 12 to 18 breaths per minute | Count breaths for one minute |
| Blood pressure | Between 90/60 and 120/80 mm Hg (systolic over diastolic) | An inflatable cuff and a gauge |
The same article says normal vital signs change with age, sex, weight, exercise capability and overall health, so one reading never makes a diagnosis. Blood-oxygen saturation, measured with a pulse oximeter, is often added.
Your data-portrait questions
For any chart: who collected the data and why; who is the audience; what is emphasized and what is left out; what feeling the design creates, and whether the data supports it. Answer each for Chart A, B or C, or an ECG trace, in a sentence.
Sources: Du Bois, Assessed value of household and kitchen furniture owned by Georgia Negroes, LOC 2013650445 (loc.gov); Du Bois, Illiteracy, LOC 2013650433 (loc.gov); Du Bois, City and rural population. 1890., LOC 2013650430 (loc.gov); Du Bois Collection assembled for the Paris Exposition of 1900, LOC 2005682657 (loc.gov); Nobel Prize in Physiology or Medicine 1924, Einthoven (nobelprize.org); Hurst, Naming of the Waves in the ECG, Circulation 98:1937 (1998) (ahajournals.org); MedlinePlus, Vital signs (medlineplus.gov)