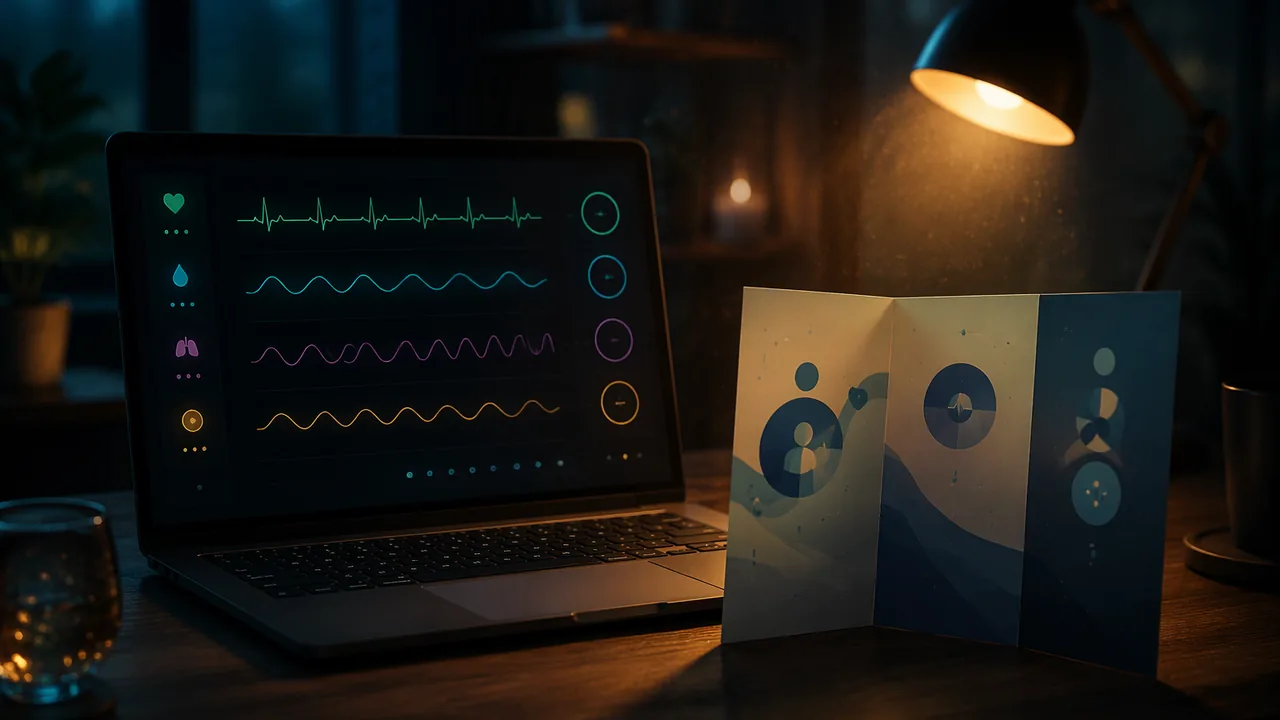
produce an interactive vital-sign visualization and a patient brochure that work together as one accurate, well-designed body of work, and present them.
Instruction
This task pairs two media, code and print, around one subject: how the body’s signals are measured and understood. The standard asks you to make them work as a unified body of work, with consistent themes and style across both forms.
Piece 1: the interactive visualization. Build on your Lesson 4.2 sketch. It must visualize the provided illustrative vital-sign dataset, clearly labeled as illustrative; any pulse counts of your own from Lesson 4.2 stay private and are not part of the submitted work. Every visual variable must be mapped to a data value on purpose, recorded in your mapping table. It must be interactive: the viewer does something (moves the mouse, clicks, presses a key) to reveal detail, compare readings or change the view. And it must be honest: no diagnostic labels, and a short on-screen note saying what the data is and what it cannot tell you.
Piece 2: the brochure. Build on your Lesson 4.4 draft. It explains one diagnostic tool or imaging method in plain language, with each panel answering a patient’s question and every fact traceable to NIH, MedlinePlus or OpenStax, and it is labeled on the back as student design work, not medical advice. It includes at least two original illustrations of the patient’s experience.
Making them one body of work. Share a palette, typeface and visual motif across both. If your visualization uses pulsing circles, perhaps the brochure’s section markers do too. If the brochure explains blood pressure measurement, perhaps the visualization shows pulse readings from the same kind of monitor. A viewer who sees both should recognize the same maker and the same idea.
Privacy. The only data in your work is the illustrative dataset. No one’s real health data appears, including your own or a family member’s. Screenshots must not show a name, an account or an email address.
The design statement. In about 600 words: your mapping table and the reasoning behind it; your brochure’s reading order and why; how the two pieces share a visual system; how the work protects privacy; and your sources.
The four stages. Stage 1: plan with mapping table, brochure panel map and shared style sheet. Stage 2: test both drafts after a day away, using the testing sheets in the reading: use the visualization as if you had never seen it and note what you learn, then read the brochure as a patient and record a teach-back in your own words, checking it against the sources. An optional family member or other adult may be the first-time tester instead. Stage 3: revised finals and design statement. Stage 4: a recorded demonstration in which you show the interaction, walk through the brochure and answer the course’s published questions about accuracy and design.
Why this matters for the year. In Semester B you will critique and build AI systems that read exactly these kinds of signals. Understanding the data from the inside, how it is collected, what it means and whom it describes, is what lets you design AI media responsibly.
📖 Read for this lesson
The reading opens over the lesson; close it to come back to exactly where you were. The checks below draw on it.
Formative check
Work through these before moving on. They are not graded — they tell you whether the standard below has landed yet.
Which change would do most to make the visualization and brochure read as one body of work?
A family member’s pulse readings may appear in your visualization if you remove their name.
How confident are you that you can produce a unified, accurate interactive visualization and patient brochure and present them?
Unit 4 checkpoint
Do this before you start the task. It covers the whole unit and tells you what to review first.
An invented example person counts 17 beats in 15 seconds. What is the heart rate?
The pressure in the arteries when the heart rests between beats is the pressure.
Du Bois’s charts show that a visualization can be precise and still have a strong visual voice and argument.
With map(bpm, 40, 120, 270, 30), where is 80 bpm drawn?
In the starter sketch, position and pulse speed both show heart rate. This is called:
Highlighting readings in a new color tells viewers those readings matter, so the designer should be ready to say why.
Which is a HIPAA covered entity?
HIPAA’s Safe Harbor method lists kinds of identifiers to remove (give a number).
Removing names always makes a health dataset impossible to re-identify.
Which imaging method builds images from the echoes of high-frequency sound waves?
A letter-size sheet folded in three makes panels (give a number).
Submit: interactive p5.js visualization + patient brochure + 600-word design statement + demonstration
Task: Code an interactive visualization of the provided illustrative vital-sign dataset (clearly labeled as illustrative) and design a tri-fold patient brochure on one diagnostic tool or imaging method, labeled as student design work. The two pieces share a visual system. The design statement explains your data mappings, reading order, shared style, privacy protections and sources.
Submission workflow
- Stage 1 — Plan. Mapping table, brochure panel map with patient questions, shared style sheet (palette, type, motif) and source list.
- Stage 2 — Testing. After a day away, test both drafts with the reading’s testing sheets: use the visualization without instructions and note what you learn, then read the brochure as a patient and record a teach-back. An optional family member or other adult may act as the first-time tester. Submit both sheets and your revision plan.
- Stage 3 — Revised final. Final sketch (downloaded file and link or screenshots), final brochure and the 600-word design statement.
- Stage 4 — Demonstration. Recorded demonstration of both pieces, then answers to the course’s published questions on accuracy and design.
How it is scored
| Criterion | What proficient looks like |
|---|---|
| Unified transmedia production (MA:Pr4A.II) | Visualization and brochure retain thematic integrity and stylistic consistency across code and print. |
| Production craft (MA:Cr3A.II) | Deliberate, well-executed mappings, interaction, layout and illustration. |
| Accuracy and honesty (WHST.11-12.2) | Every fact sourced; data labeled as real or illustrative; no diagnostic claims; privacy protected. |
| Presentation design (MA:Pr6A.II, SL.11-12.5) | Recorded demonstration shows the interaction and reading order clearly and answers the published questions accurately. |
| Testing and revision (MA:Re9A.II) | Testing results lead to specific, defensible revisions. |
Portfolio Brief: Reading the Body’s Signals, with Data, Rubric Levels, an Exemplar, Two Self-Testing Sheets and the Published Demonstration Questions
SLS original brief and constructed exemplar; the illustrative data set is the invented data of Lesson 4.2; reference ranges from MedlinePlus Medical Encyclopedia, Vital signs (002341), retrieved Sept. 26, 2026; contrast ratio computed with the WCAG 2.1 formula; self-testing sheets, privacy rules and published demonstration questions adapted for RLP as SLS original (2026-11-10) · SLS original
Why this reading. The portfolio task asks for an interactive sketch, a brochure, a design statement, two kinds of testing and a recorded demonstration, and refers to a provided dataset and to reading “the rubric.” This is the full brief: the data you use, what each rubric level looks like, a constructed exemplar with a mapping table and the on-screen note written out, a brochure outline, the two testing sheets you use on your own work, and the published questions your demonstration answers. The exemplar is an SLS original, not a student’s work, and the data are the lesson’s invented illustrative set.
The assignment in brief
Make two pieces that read as one body of work: (1) an interactive p5.js sketch that visualizes a vital-sign dataset, and (2) a tri-fold patient brochure on one diagnostic tool or imaging method. Share a palette, typeface and visual motif. Write a design statement of about 600 words. Record a demonstration of both pieces that answers the published questions on accuracy and design.
Data you may use
The illustrative dataset from Lesson 4.2, which must be labeled illustrative, invented for teaching, not a real patient. Any pulse counts of your own stay private and are not part of the submitted work; nobody else’s readings are used. The data: 72, 74, 71, 73, 75, 72, 70, 96, 98, 74, 73, 72 beats per minute, one reading a minute. For reference ranges use the MedlinePlus Medical Encyclopedia article on vital signs: resting adult pulse 60 to 100 beats per minute; temperature 97.7°F to 99.1°F; breathing 12 to 18 per minute; blood pressure between 90/60 and 120/80 mm Hg. If you need a numeric source for the brochure, use the facts and sources in the Lesson 4.4 reading.
What each level looks like
| Criterion | Not yet | Proficient | Advanced |
|---|---|---|---|
| Unified transmedia production | Two pieces with different palettes and no shared idea | Same palette, typeface and one motif, used on purpose in both | The motif carries meaning in both (for example, the pulsing circle is also the panel marker) |
| Production craft | Mappings not recorded; interaction breaks; labels overlap | Every visual variable in a mapping table; one working interaction; clean layout | Interaction reveals something the static picture cannot |
| Accuracy and honesty | Diagnostic labels; unsourced facts; data not labeled | Data labeled illustrative; every fact sourced; brochure labeled as student design work; no diagnosis; no personal data | Names what the data cannot show, on screen and in the brochure |
| Presentation design | Reads a script; interaction not demonstrated | Shows the interaction and reading order; answers the published questions accurately | Uses the pieces themselves to answer a hard question |
| Testing and revision | No test results | Test results lead to at least two changes | Test results are quoted in the statement and tied to a change |
A constructed exemplar (SLS original)
Shared style. Palette: navy #1F2A44 for text and headings, teal #0B6E6E for anything about pulse, amber #E8A33D only on navy (contrast 6.6 to 1), white ground. One typeface family. Motif: a circle that pulses, used as the sketch’s data mark and as the brochure’s panel-number marker.
Sketch, described. A 480 × 300 canvas on white. Twelve teal circles across, each pulsing at its reading’s rate, placed vertically by rate; two thin gray guide lines at 60 and 100 beats per minute. Moving the mouse near a circle shows its reading and its position in the series (“Reading 8: 96 bpm”). A line of 12-point navy text at the bottom always shows: “Illustrative data, invented for teaching. It cannot tell you anything about anyone’s health.”
| Data field | Visual variable | Range | Reason |
|---|---|---|---|
| Heart rate | Vertical position | 40–120 bpm to y = 270–30 px | Easiest variable to compare |
| Heart rate | Pulse speed | bpm ÷ 60 per second | Redundant encoding: the picture beats at the rate it shows |
| Reading number | Horizontal position | 0–11 to x = 60–440 px | Earlier to later, left to right |
| Mouse near a circle | Label and amber ring | Within 15 px | Detail on demand, so the picture stays uncluttered |
Brochure, outlined. Tool: ultrasound. Panels (patient questions): 1 “What is an ultrasound?” 2 “Why am I having one?” 3 “What will happen?” 4 “Will it hurt?” 5 “Is it safe?” 6 “Where can I learn more?” Facts used (from the Lesson 4.4 reading, sourced to the National Institute of Biomedical Imaging and Bioengineering): a transducer sends sound into the body and detects echoes; the technician applies gel; diagnostic ultrasound is generally regarded as safe and uses no ionizing radiation. Two original illustrations of the experience: a person lying on a bed with a transducer on the belly and a gel bottle beside it, and a small “echo” diagram. The same teal circle marks each panel number.
Design-statement excerpt (about 140 of 600 words). “My two pieces share one idea: a circle that pulses. In the sketch each circle pulses at the rate it shows, so the picture beats; in the brochure the same circle numbers the panels, so a reader who saw one recognizes the other. Testing changed the sketch: when I came back to it a day later I did not notice the guide lines until I made them darker, and my aunt, trying it as a first-time tester, asked what the circles meant, so I added a first-screen line. I made no diagnostic label: readings 8 and 9 are higher, and I say only that, because the data cannot say why. No one’s real data appears; I used the illustrative dataset, and the note on screen says so. Every fact in the brochure is traced to a named source on panel 6, which also says the brochure is student design work, not medical advice.”
Why this is strong. One motif does real work in both media; every variable is in a table with a reason; the honesty note is on the screen, not only in the statement; a test result changed something, and the statement says exactly what.
Testing sheets (use them on your own drafts)
Wait at least a day after finishing the drafts, so you meet them as a stranger would. An optional family member or other adult may be the first-time tester for Sheet 1 instead of you; give them no instructions.
Sheet 1, the visualization (no instructions). Spend two minutes with the sketch without reading your notes, or watch your tester silently. Record: (1) what was tried first; (2) what the circles seem to mean, in plain words; (3) whether the interaction was found, and how long it took; (4) what a viewer might conclude about the person the data came from (if anything medical comes to mind, the on-screen note failed); (5) one thing that was wanted and not there.
Sheet 2, the brochure (teach-back). Read the brochure as a patient for two minutes. Then close it and record yourself answering: “In my own words, what will happen during the scan?” Play it back, check each point against the sources, and note where you were wrong or unsure: those are places the brochure is unclear. Then find the panel that answers “Is it safe?” and its source.
Revision plan: for each finding, what you changed, where, and the result of testing once more.
Privacy rules
The only data in the work is the illustrative dataset. No one’s real health data appears, including your own or a family member’s. Screenshots must not show a name, an account or an email address. The blood pressure readout in your work is the illustrative one from the Lesson 4.2 reading.
Recorded demonstration, three minutes, and the published questions
0:00–0:30 the idea both pieces share. 0:30–1:30 the sketch: what each variable means, then the interaction (record your screen with a free screen recorder, or film the screen with a phone). 1:30–2:15 the brochure: open it as a patient would and read the panels in order. 2:15–3:00 one change your testing caused. Then, on the same recording, answer these published questions: (1) Which data value does each visual variable show, and why that pairing? (2) What can this data not tell a viewer, and where does your work say so? (3) Which source supports your “Is it safe?” panel? (4) How do the two pieces share one visual system?
Sources: MedlinePlus, Vital signs (medlineplus.gov); NIBIB, Ultrasound (nibib.nih.gov)