analyze how three historical information designers turned complex data into readable images, and explain what the terms narrow AI, artificial general intelligence and superintelligence mean.
Instruction
This course asks you to make art that explains artificial intelligence and medicine. That is hard, because the most important parts of both are invisible: a model’s statistics, a patient’s blood pressure, the flow of data through a hospital. Designers have faced this problem for a long time, and they have left us methods.
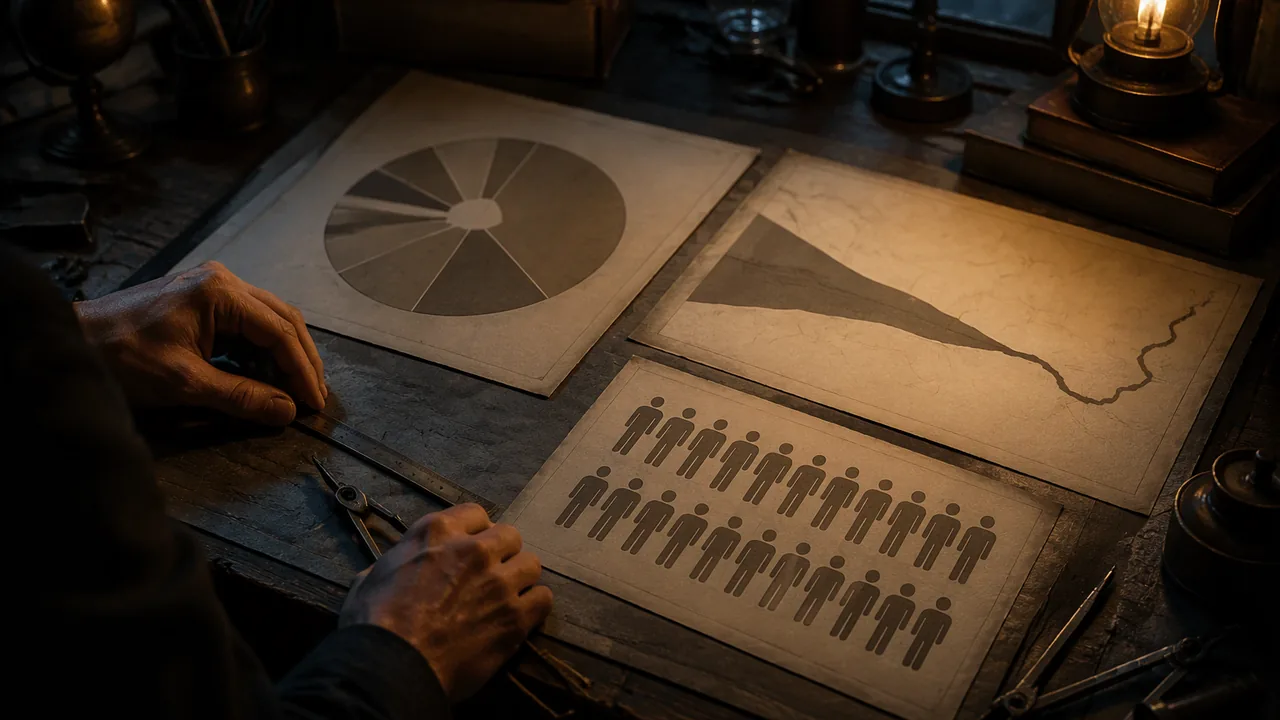
Florence Nightingale (1858). Nightingale is remembered as a nurse, but she was also a statistician. After the Crimean War she published polar-area diagrams showing, month by month, how many British soldiers died of wounds and how many died of preventable diseases in the army hospitals. Each month is a wedge; the area of each colored segment shows the number of deaths. The design decision was the argument: the disease segments are so much larger than the wound segments that a reader sees at once that sanitation, not battle, was the main killer. She was designing to change policy.
Charles Joseph Minard (1869). Minard’s map of Napoleon’s 1812 campaign into Russia draws the army as a band whose width is the number of soldiers. The band narrows as it moves toward Moscow and shrinks further on the retreat, with a temperature line beneath it. One image carries size, place, direction, time and temperature.
Otto Neurath and Isotype (1920s-1930s). Working in Vienna with the designer Gerd Arntz and with Marie Neurath, Neurath built a system of simple, repeatable pictograms in which one symbol always stands for a fixed quantity. Instead of one big figure for a big number, you see more figures. The rule makes comparisons honest and readable across languages.
Three moves to borrow. First, encoding: each visual variable (length, area, color, position) stands for one piece of data, consistently. Second, hierarchy: the most important comparison is the most visible thing on the page. Third, sequence: the reader’s eye is led through the explanation in order.
What do we mean by AI? You will explain AI to others, so you need precise words. Narrow AI performs a specific task, such as flagging a possible diabetic eye disease in a retinal photograph, transcribing speech or recommending a video. Every AI system in use today, in medicine or anywhere else, is narrow. Artificial general intelligence (AGI) is a hypothetical system that could learn and perform the wide range of intellectual tasks a person can. Researchers disagree sharply about whether and when it could be built. Superintelligence is a further hypothetical: a system far beyond human ability in nearly every domain, discussed by philosophers such as Nick Bostrom. When a headline says a product is “thinking”, ask which of these it means. The honest answer is almost always a narrow system doing one task well under particular conditions.
Why this matters for design. Images of glowing brains and humanoid robots suggest AGI when the product is a narrow classifier. Nightingale persuaded by showing the data honestly. Your first responsibility as a designer of AI media is the same: make the reader see what the system actually does.
📖 Read for this lesson
The reading opens over the lesson; close it to come back to exactly where you were. The checks below draw on it.
Formative check
Work through these before moving on. They are not graded — they tell you whether the standard below has landed yet.
In Nightingale’s polar-area diagram, what carries the main argument?
A hospital tool that flags possible diabetic eye disease in retinal photographs is an example of artificial general intelligence.
Narrow AI
Tap to revealOne task, such as flagging a retinal image; all AI in use today
AGI
Tap to revealHypothetical general learner across tasks
Superintelligence
Tap to revealHypothetical system far beyond humans in almost every domain
Encoding
Tap to revealEach visual variable consistently stands for one data value
Isotype rule
Tap to revealOne symbol always stands for the same quantity
Choose Nightingale, Minard or Neurath. In 5-7 sentences, explain which design decision carries the argument of the work and how you could borrow that decision to explain something about AI in medicine.
How confident are you that you can analyze how historical designers made complex data readable, and define narrow AI, AGI and superintelligence accurately?
Practice
Work these on paper or in your notebook, then open Check your answer. Aim for all of Fluency and Application; try at least one Challenge.
Printable version: this unit’s practice workbook (PDF)
Fluency
Build speed and accuracy with the core skill.
- Match each designer to the work the lesson describes: (a) Florence Nightingale; (b) Charles Joseph Minard; (c) Otto Neurath. Works: polar-area diagrams of army hospital deaths; a system of repeatable pictograms called Isotype; a map of Napoleon’s 1812 campaign into Russia.
Check your answer
Answer: (a) Nightingale: polar-area diagrams of deaths from wounds and preventable disease (1858); (b) Minard: the map of Napoleon’s 1812 campaign (1869); (c) Neurath: Isotype pictograms (1920s-1930s), built with Gerd Arntz and Marie Neurath.Each designer solved the same problem, making invisible data readable, with a different device: wedge area, band width and repeated symbols. - Define visual encoding and visual hierarchy in one sentence each.
Check your answer
Answer: Visual encoding is the rule by which a visual property (length, area, color or position) consistently stands for one data value. Visual hierarchy is the ordering of elements by visual weight so the most important information is seen first.A strong answer names at least two visual variables for encoding and connects hierarchy to what the viewer sees first. - Label each description as narrow AI, AGI or superintelligence: (a) a hypothetical system far beyond human ability in nearly every domain; (b) a tool that transcribes speech; (c) a hypothetical system that could learn the full range of intellectual tasks a person can.
Check your answer
Answer: (a) superintelligence; (b) narrow AI; (c) artificial general intelligence (AGI).Only (b) exists. Every AI system in use today is narrow; AGI and superintelligence are hypothetical.
Application
Use the skill in context. Show your reasoning.
- Minard’s single image carries five kinds of information. List them and say which visual feature carries the number of soldiers.
Check your answer
Answer: Size of the army, place, direction, time and temperature. The width of the band carries the number of soldiers.The band narrows toward Moscow and shrinks further on the retreat; the temperature line runs beneath it. Width is the encoding for size. - An Isotype chart uses one figure to stand for 1,000 people. How many figures should it draw for a group of 6,000 people and for a group of 2,500 people? Why does Isotype draw more figures instead of one bigger figure?
Check your answer
Answer: 6 figures for 6,000 and 2.5 figures (two whole figures and a half figure) for 2,500. Isotype keeps one symbol equal to a fixed quantity so the reader can compare by counting, which keeps comparisons honest.6,000 / 1,000 = 6; 2,500 / 1,000 = 2.5. A single enlarged figure grows in area as well as height, which makes a big number look bigger than it is; repeated equal figures avoid that. - A news headline says a new hospital app ‘thinks like a doctor’. The app flags possible diabetic eye disease in retinal photographs. Which category of AI is it, and how would you rewrite the headline honestly?
Check your answer
Answer: Narrow AI. Honest version: ‘New app flags possible diabetic eye disease in retinal photographs.’The app performs one specific task under particular conditions. ‘Thinks like a doctor’ suggests general intelligence, which does not exist. A strong rewrite names the one task. - Nightingale’s diagram argued that sanitation, not battle, was the main killer. In 3-4 sentences, explain how encoding and hierarchy work together to make that argument.
Check your answer
Answer: Model: Each wedge is a month, and the area of each colored segment encodes the number of deaths from one cause. Because the disease segments are far larger than the wound segments, the biggest, most visible shapes on the page are the disease deaths. Hierarchy therefore puts the key comparison first. The reader sees the argument before reading any numbers.A strong answer names the encoding (area for deaths, color for cause) and explains that the largest element carries the central comparison.
Challenge
Stretch problems. Expect to think before you write.
- A designer wants to explain a narrow AI tool that flags possible eye disease. Plan, in 4-5 sentences, an image that borrows one of the three moves (encoding, hierarchy or sequence) from Nightingale, Minard or Neurath, and explain why it is more honest than a glowing-brain stock image.
Check your answer
Answer: Model: Borrow Neurath’s Isotype encoding. Show 100 small eye icons, one per photograph, and color the ones the tool flags. A short numbered sequence underneath shows photo in, flag out, doctor reviews. The image shows exactly what the system does, one task on one kind of input. A glowing brain suggests a thinking machine, which implies AGI when the product is a narrow classifier.A strong answer names the borrowed move and its source, describes what each visual element encodes, and explains why the image matches the narrow task. Any of the three moves is acceptable.
Review
Keep earlier skills sharp.
- Prerequisite review: a chart shows two quantities, 120 and 30. How many times larger is the first? If one Isotype figure stands for 10, how many figures does each need?
Check your answer
Answer: 4 times larger. 12 figures and 3 figures.120 / 30 = 4; 120 / 10 = 12; 30 / 10 = 3. Counting figures shows the same 4-to-1 comparison.
Two Data Arguments You Can Analyze: Nightingale’s Coxcomb (1858) and Minard’s Map (1869)
F. Nightingale, Notes on Matters Affecting the Health, Efficiency, and Hospital Administration of the British Army (1858), Table Nos. 1 and 2 and the plate ‘Diagram of the Causes of Mortality in the Army in the East’ (Internet Archive b20387118; David Rumsey 10563.002); C. J. Minard, Carte figurative des pertes successives en hommes de l’Armee Francaise dans la campagne de Russie 1812-1813 (Paris, 20 Nov. 1869; BnF Gallica btv1b52504201x; band values from M. Friendly’s HistData transcription); NIST AI 100-1 (Jan. 2023); FDA De Novo summary DEN180001; retrieved Sept. 26, 2026 · Public domain (1858 and 1869 works; U.S. government works), with SLS original description and worked example
Why this reading. The lesson asks you to analyze how Nightingale and Minard turned data into a readable argument, and it does not put either graphic in front of you. This reading does: it gives the record for each, describes the design in words, prints Nightingale’s own monthly numbers so you can check what the wedges encode, and gives the values printed on Minard’s band. What to look for: which single visual variable carries each argument, and what each design hides.
1. Florence Nightingale, “Diagram of the Causes of Mortality in the Army in the East” (1858)
The record. Colored polar-area (“coxcomb”) diagram, printed as a plate in Nightingale’s Notes on Matters Affecting the Health, Efficiency, and Hospital Administration of the British Army (London, 1858; the book’s list of illustrations places the plate at p. 315). Public domain. A scan of the whole book is at the Internet Archive (identifier b20387118, from the Wellcome Library), and the plate itself is in the David Rumsey Map Collection (list no. 10563.002, the 1859 printing prepared for Harriet Martineau’s England and Her Soldiers). Retrieved 26 September 2026.
What the design looks like. Two circles side by side. Each circle is cut into twelve equal wedges, one per month, and every wedge in a month is drawn from the same center point. The right-hand circle covers April 1854 to March 1855; the left-hand circle covers April 1855 to March 1856. In each month three overlapping wedges are drawn in three colors: blue for deaths from preventable (“zymotic”) disease such as fevers and dysentery, red for deaths from wounds, black for all other causes. The area of each wedge, measured from the center, is proportional to that month’s deaths. In the first circle blue is much the largest in nearly every month, which is the point.
The numbers behind the wedges. These are the deaths printed in her own Table No. 2, “Estimated Average Monthly Strength of the Army; the Deaths and Annual Rate of Mortality per 1,000 in each month, from 1 April 1854 to March 1856, in the Hospitals of the Army in the East.” I checked every disease figure against the rate printed beside it in the same table (for January 1855, 2,761 deaths ÷ 32,393 men × 12 × 1,000 = 1,022.8 per 1,000, the rate she prints).
| Month | Estimated army strength | Deaths: zymotic (preventable) disease | Deaths: wounds and injuries | Deaths: all other causes |
|---|---|---|---|---|
| Apr 1854 | 8,571 | 1 | 0 | 5 |
| May 1854 | 23,333 | 12 | 0 | 9 |
| Jun 1854 | 28,333 | 11 | 0 | 6 |
| Jul 1854 | 28,722 | 359 | 0 | 23 |
| Aug 1854 | 30,246 | 828 | 1 | 30 |
| Sep 1854 | 30,290 | 788 | 81 | 70 |
| Oct 1854 | 30,643 | 503 | 132 | 128 |
| Nov 1854 | 29,736 | 844 | 287 | 106 |
| Dec 1854 | 32,779 | 1,725 | 114 | 131 |
| Jan 1855 | 32,393 | 2,761 | 83 | 324 |
| Feb 1855 | 30,919 | 2,120 | 42 | 361 |
| Mar 1855 | 30,107 | 1,205 | 32 | 172 |
| Year total | 11,157 | 772 | 1,365 |
Second year, April 1855 to March 1856: zymotic 3,319, wounds 986, other 383. The sanitary commission reached the Crimea in March 1855; from April 1855 the disease figures fall almost every month. Only one month in the whole table has more wounds than disease deaths: September 1855 (276 against 189).
What she wrote. Her Table No. 1 gives annual deaths per hundred: 18.7 from zymotic disease among the army in the East against 0.2 for English men aged 15 to 45 at home, and 22.9 from all causes against 1.0. She concludes that deaths from wounds are “utter insignificance” beside deaths from disease, which she says killed in “tens of thousands” where violence killed thousands (the scan’s text is partly garbled on this page, so treat these two quoted phrases as my reading of it).
Analyze it. (a) Encoding: area, not length, carries the number. The January 1855 disease figure is 2,761 and the wounds figure 83, so the disease area is about 33 times larger; in a polar-area chart the disease wedge is only about 5.8 times longer (the square root of 33). Ask whether a reader judging by eye recovers the true ratio. (b) Hierarchy: color and size put the blue wedge first. (c) Hides: the table also gives rates per soldier but the wedges show totals; a growing army would raise totals on its own. (d) Audience: she made it for members of Parliament and civil servants who would not read a page of statistics.
2. Charles Joseph Minard, “Carte figurative des pertes successives en hommes de l’Armée Française dans la campagne de Russie 1812–1813” (1869)
The record. Lithograph map with a chart beneath it, signed by Minard as retired Inspector General of Bridges and Roads, Paris, 20 November 1869; published by Régnier & Dourdet. Public domain. A cataloged copy is at the Bibliothèque nationale de France (Gallica, ark:/12148/btv1b52504201x). Retrieved 26 September 2026 from the Gallica search record, the map’s printed legend as transcribed at masswerk.at, and the Wikimedia Commons file description. I could not open the Gallica page itself, so the figures below are a published transcription of the printed band widths (Michael Friendly, HistData data set Minard.troops), not my own measurement of the plate.
What the design looks like. A map of eastern Europe, west at left, Moscow at right. A thick band runs from the Niemen River toward Moscow. Its width shows the number of men, at one millimeter for ten thousand. The advance is one color (brown or red, depending on the printing) and the retreat is black, drawn back along the same route. Two thin branches split from the main band on the way in. Under the map a second panel plots temperature during the retreat on the réaumur scale, tied to places along the route by dates.
| Where | Men (band width) | Width on the page at 1 mm per 10,000 |
|---|---|---|
| Advance, at the Niemen (main column) | 340,000 | 34 mm |
| Advance, two side columns at the start | 60,000 and 22,000 | 6 mm and 2.2 mm |
| Advance, at Smolensk | 145,000 | 14.5 mm |
| Reaching Moscow, and leaving it | 100,000 | 10 mm |
| Retreat, near Smolensk (west of Moscow) | 24,000 | 2.4 mm |
| Retreat, at the last point of the main band | 4,000 | 0.4 mm |
The main band starts at 340,000 and the two side columns add 60,000 and 22,000, which gives the 422,000 usually quoted for the crossing. The main band ends at 4,000 and a side branch at 6,000, which is how the map is cited for about 10,000 survivors.
| Date (1812) | Temperature, réaumur | Same in °C (réaumur × 1.25) |
|---|---|---|
| 18 Oct | 0° | 0° |
| 9 Nov | −9° | −11.3° |
| 14 Nov | −21° | −26.3° |
| 28 Nov | −20° | −25° |
| 1 Dec | −24° | −30° |
| 6 Dec | −30° | −37.5° |
What he wrote. The legend says the numbers of men are shown by the widths of the colored zones, one millimeter for ten thousand, and that he drew on works by Thiers, Ségur, Fezensac and Chambray and on the unpublished diary of Jacob, an army pharmacist.
Analyze it. Encoding: width equals men, position equals place, color equals direction, a separate line equals temperature. Hierarchy: the band is widest at the left, so the eye starts where the army was strongest and follows it down to a thread. Sequence: left to right along the advance, then back along the retreat. Hides: how the men died (cold, hunger, battle, desertion) is not separated; the temperature line invites a cause the map does not prove.
3. Isotype, described (not reproduced)
Otto Neurath, Gerd Arntz and Marie Neurath used one repeated pictogram for a fixed quantity, so more of the same figure means more of the thing, never a bigger figure. I describe this in my own words and host no image, since their pictograms are not clearly in the public domain. SLS original worked example (invented for teaching): if one soldier icon stands for 10,000 men, Minard’s 340,000 would be 34 icons and the 4,000 at the end would be less than half an icon. The rule keeps a comparison honest, but it cannot show the smooth shrinking of a band, which is Minard’s design gain.
4. Words to define, from primary sources
The U.S. National Institute of Standards and Technology defines an AI system as “an engineered or machine-based system that can, for a given set of objectives, generate outputs such as predictions, recommendations, or decisions influencing real or virtual environments” (AI Risk Management Framework 1.0, NIST AI 100-1, January 2023, doi 10.6028/NIST.AI.100-1; public domain). Note “for a given set of objectives.” Real systems have one. The FDA’s decision summary for IDx-DR (DEN180001) shows what that looks like: the device is “indicated for use by health care providers to automatically detect more than mild diabetic retinopathy (mtmDR) in adults diagnosed with diabetes who have not been previously diagnosed with diabetic retinopathy,” and it “is not intended to detect concomitant diseases.” That is a narrow system, described by its regulator. Neither document describes artificial general intelligence or superintelligence; those remain hypotheses, not products.
Sources: Nightingale, Notes on Matters Affecting the Health, Efficiency, and Hospital Administration of the British Army (1858), Internet Archive b20387118 (archive.org); Nightingale, Diagram of the Causes of Mortality in the Army in the East, David Rumsey Map Collection 10563.002 (Internet Archive copy) (archive.org); Minard, Carte figurative des pertes successives… 1869, BnF Gallica (gallica.bnf.fr); NIST AI Risk Management Framework 1.0 (NIST AI 100-1) (doi.org); FDA De Novo decision summary DEN180001 (IDx-DR) (accessdata.fda.gov)