4.09 Performance Task: Explaining Variation in a Crop
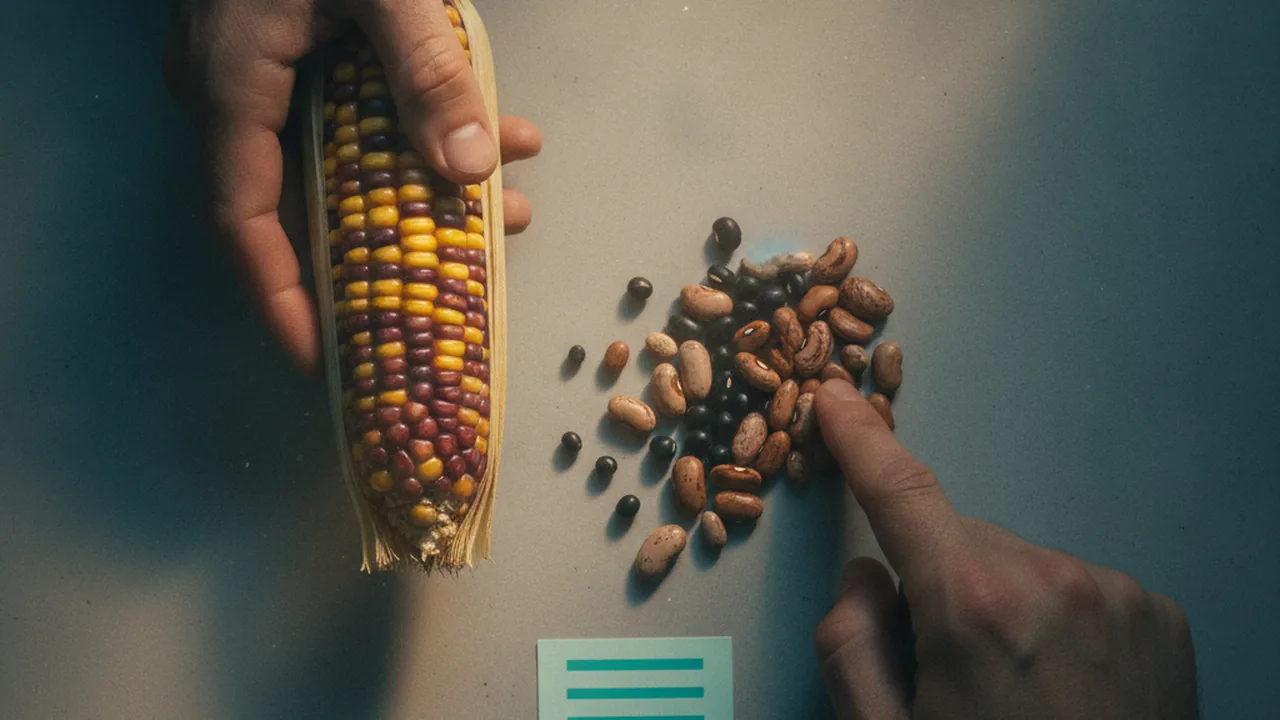
construct and defend a report that uses probability and statistics to explain the variation of discrete and continuous traits in a crop, and the genetic and environmental sources of that variation, for the seed library.
- I can use statistics and probability to analyze data about traits in a population.
- I can determine how environmental factors are related to how often a trait appears in a population using statistical analysis.
- I can use reasoning and valid evidence to explain that new combinations of DNA can come from meiosis, errors during replication, and mutations caused by environmental factors.
- I can use a model of DNA to ask questions that help clarify how DNA codes for proteins and how those proteins cause traits in an organism.
- I can use a model of DNA to ask questions about how cells regulate which DNA and chromosomes are used.
- I can use a model of DNA to ask questions about the functions of non-protein coding sections of DNA, such as their role in regulation.
Phase 5: Prove It
Warm-Up ~5 min
Do Now. The seed library’s volunteers know gardening but not genetics. Write one sentence that explains “dominant allele” without using the word allele.
Your ear gives χ2 = 0.384 with 1 degree of freedom. What should your report say?
Instruction ~10 min
The scenario. The community seed library lends corn and bean seed to home and school gardeners. Its volunteers have two questions: why do the kernels on our ears come in such regular ratios, and why do the seeds from one plant vary so much in size? You will answer both in a report written for the volunteers, who know gardening but not genetics, and end with a seed-saving recommendation built on your trial plan.
What a strong report contains.
- The discrete trait. Explain kernel color (or color and texture) with alleles, meiosis and a Punnett square. Test your own corn-ear counts with chi-square, showing the expected counts, the calculation, the degrees of freedom and your decision. Say what the result means in plain language, and what it does not prove.
- The continuous trait. Present your bean-length histogram with the mean and standard deviation. Explain the shape with polygenic inheritance, using the three-gene model or a larger one, and explain what the environment adds.
- Where the variation comes from. Explain at least two of the sources of heritable variation from 4.04 (independent assortment, crossing over, replication errors or environmental mutagens) and why each would make offspring differ. Distinguish heritable variation from variation caused by growing conditions, and say whether your evidence shows cause or only correlation.
- A recommendation. Advise the library, using your version 2 trial plan: for example, how to keep purple corn true to type, or how to test whether big saved beans really breed big beans.
A worked example of one link. Claim: the purple : yellow ratio on our ear is consistent with a cross between two heterozygous plants. Evidence: 381 purple and 119 yellow, with expected counts 375 and 125, give χ2 = 0.384 with 1 degree of freedom, below the critical value 3.84. Reasoning: each parent’s meiosis gives half P and half p gametes, so one quarter of kernels should be pp; the differences from 125 are the size we expect from chance.
Accuracy and care. Use your own data where you have it and label any illustrative or sample data. Genetics can be personal, so keep examples to crops and hypothetical pedigrees.
Presentation. In four minutes, live or recorded, present your two key displays to the library’s volunteers (classmates, staff or family playing them) and answer one question about your statistics.
Guided Exercises ~15 min
Plan and check your draft with these prompts.
Independent Practice ~10 min
Work on the stage your teacher assigns.
Draft the “where the variation comes from” section: explain two sources of heritable variation, one environmental effect, and answer one counter-claim with evidence.
Project task: Explaining Variation in a Crop (900-1,300 words with a chi-square test and a histogram) + four-minute presentation
Task: Write a report for the community seed library’s volunteers that explains (1) the ratio of kernel phenotypes on a corn ear, with Punnett squares and a chi-square test, and (2) the distribution of seed length in beans, with a histogram, mean and standard deviation. Explain the genetic sources of variation, separate them from environmental ones, judge whether your evidence shows cause or correlation, and end with a seed-saving recommendation built on your trial plan. Use your own lab data where possible; hand-drawn displays are fully acceptable.
Submission workflow
- Stage 1: Plan. Your two data displays in draft, your chi-square calculation, and an outline showing which evidence supports each section.
- Stage 2: Peer-reviewed draft. A partner recomputes your expected counts, χ2 and summary statistics, and marks any claim without evidence; submit their notes and your revision plan.
- Stage 3: Final report. 900-1,300 words with revised displays, calculations, citations and a limitations paragraph.
- Stage 4: Presentation and defense. Four minutes, live or recorded, to the volunteers, answering one question about your statistics.
How it is scored
| Criterion | What proficient looks like |
|---|---|
| Inheritance model (HS-LS3-1) | Explains the discrete trait with alleles on homologous chromosomes, meiosis and a correct Punnett square. |
| Probability and statistics (HS-LS3-3) | Chi-square test and summary statistics are correct, with degrees of freedom, a decision and an accurate plain-language interpretation; predicts how the distribution would change in a new environment. |
| Sources of variation (HS-LS3-2) | Explains at least two sources of heritable variation accurately and distinguishes them from environmental effects. |
| Quality of evidence (HS-LS3-2) | Judges whether evidence is sufficient and reliable, separates cause from correlation, and answers a counter-claim. |
| Recommendation | The recommendation follows from the evidence and names what further data would test it. |
| Communication | Claims tied to data and cited sources; clear for a non-specialist; presentation answers a question accurately. |
Closure ~5 min
Next: the unit checkpoint, then a 360° field trip.
Exit ticket: which question from our Wonder Board can you now answer? Write the question and your answer.
How confident are you that you can use probability and statistics to explain variation in a crop and defend my conclusions.
Teacher notes
Materials: Lab Notebooks with all unit data, trial plan version 2, rubric copies, calculators or spreadsheets, a timer for presentations.
Timing: the task runs across about three sessions: plan and draft, peer review and revision, presentations. Writing can continue as homework.
Listen for: “chi-square proves the model”; percentages used in the chi-square formula; correlation stated as cause.
Support / stretch: give a report outline with section headings and a statistics checklist. Stretch: add the transplant-garden case study as outside evidence and explain how it strengthens your recommendation.