4.02 Project Brief and Wonder Board: The True-to-Type Seed Library
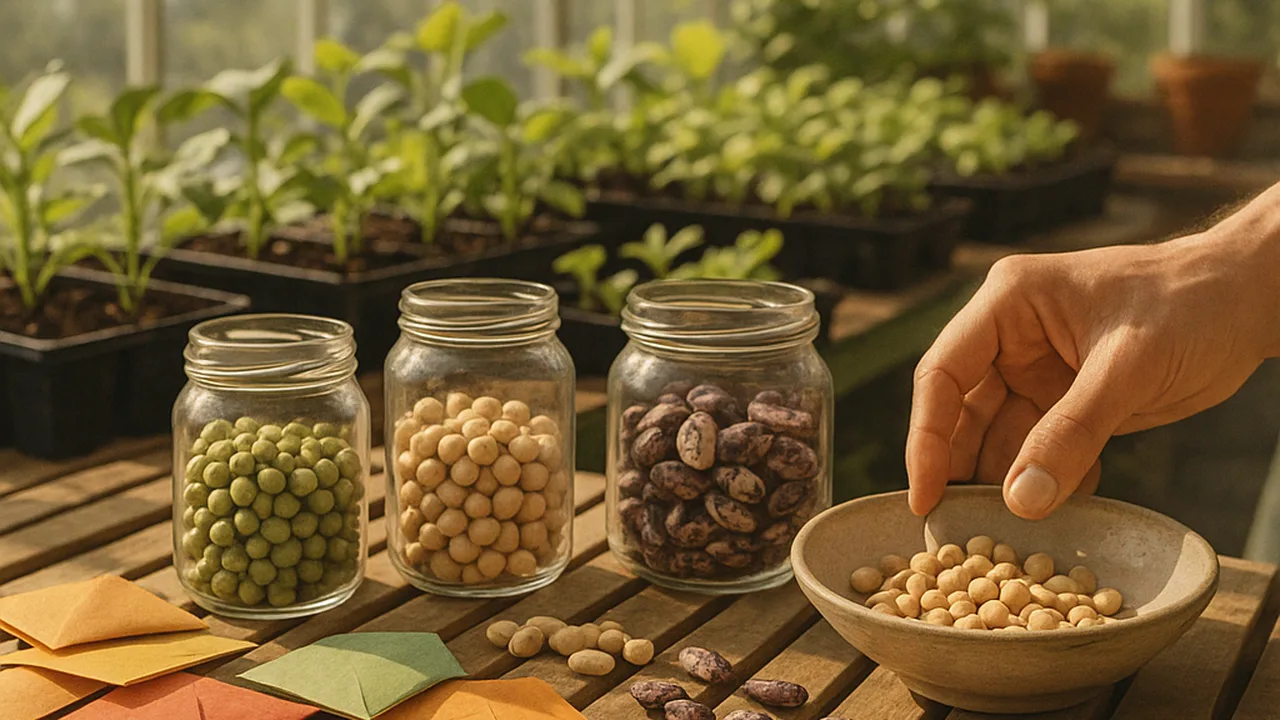
The True-to-Type Seed Library
Why do the traits in a crop come in regular ratios and also vary, how much of that variation is inherited and how much comes from the environment, and how can a seed library use that knowledge to keep its seeds true to type?
The mystery: Counted one by one, the purple and yellow kernels on an ear of corn come out close to three to one, even though every kernel is a separate chance event.
Questions we will figure out together in this unit:
- Why do yellow kernels show up on a purple ear?
- How close to 3 to 1 is close enough?
- Do genes on different chromosomes travel together?
- Where do brand-new alleles come from?
- Can sunlight change the DNA in a seed?
- Do big seeds grow big plants because of genes or the garden?
- Why are siblings, or seeds from one plant, not identical?
- How far apart should corn varieties be planted to stay true to type?
define the seed library’s problem, organize data on how often traits appear, ask questions about chromosomes and variation that data could answer, and organize our teams for the unit project.
- I can use a model of DNA to ask questions that help clarify how DNA codes for proteins and how those proteins cause traits in an organism.
- I can use a model of DNA to ask questions about how cells regulate which DNA and chromosomes are used.
- I can use a model of DNA to ask questions about the functions of non-protein coding sections of DNA, such as their role in regulation.
- I can organize data to show how often different traits appear in a population and how those traits vary.
Phase 1: Spark
Warm-Up ~5 min
Do Now. Read the client letter on the board. Underline every problem the seed library names, and star the one you think is genetics.
A borrower plants “purple corn” seed saved by someone else and gets ears with some yellow kernels. Which is the most likely genetic explanation?
Instruction ~10 min
Meet the client. A community seed library lends packets of corn and bean seed to home and school gardeners. At the end of the season, borrowers return seed they saved from their best plants. The volunteer committee writes: “Two problems keep coming up. Some ‘all-purple’ corn seed comes back and grows ears with yellow kernels. And gardeners ask whether the biggest bean seeds have ‘better genes’, or just had a better spot in the garden. We need a seed-saving guide our volunteers can trust, and a garden trial plan that can tell genes from growing conditions.”
The driving question. Why do the traits in a crop come in regular ratios and also vary, how much of that variation is inherited and how much comes from the environment, and how can a seed library use that knowledge to keep its seeds true to type?
The project. Geneticists, you will (1) count and test kernel ratios and model meiosis and mutation in the lab; (2) measure and explain continuous variation; (3) design, test and improve a garden trial plan; and (4) write and present a variation report for the library’s volunteers.
Worked example 1: organizing trait data. The library sent returned-seed records from one season (sample data). Of 40 packets of “all-purple” corn, 31 grew all-purple ears and 9 grew ears with some yellow kernels. Of the 9, 7 had been saved in gardens where yellow sweet corn grew within a few meters of the purple corn.
| Returned packets (sample data) | All-purple ears | Some yellow kernels | Total |
|---|---|---|---|
| Saver grew yellow corn nearby | 3 | 7 | 10 |
| No yellow corn near the saver | 28 | 2 | 30 |
| Total | 31 | 9 | 40 |
Organized this way, a pattern appears: 7 of 10 packets (70%) from gardens with yellow corn nearby grew some yellow kernels, but only 2 of 30 (about 7%) from gardens without. Corn is wind-pollinated, so pollen from yellow corn could have fertilized the saver’s purple ears. Kernels from that cross are Pp: they look purple, but they carry a hidden yellow allele that shows up as yellow kernels when the borrower grows them and the plants pollinate one another. The table does not yet prove cause; it raises a question we can test.
Worked example 2: questions from a chromosome model. Picture a homologous pair with the kernel-color gene marked. Questions the model raises: If a purple plant is Pp, how often will its seed give yellow kernels? Could a new allele appear by mutation? Do genes on different chromosomes travel together? Each can be answered with crosses, counts or DNA tests.
Need-to-knows. Sort the class’s need-to-knows into three bins: inheritance (How are alleles passed on? Where do new ones come from?), data (How close to 3 : 1 is close enough? How do we describe size variation?) and the trial (How do we separate genes from growing conditions? How many plants do we need?).
| Need-to-know | Bin (inheritance, data or trial) | Lesson that answers it |
|---|---|---|
Teams and roles. Teams of four rotate weekly: Principal Investigator, Data Analyst, Lab Manager and Communicator.
Guided Exercises ~15 min
Use the client letter and the returned-seed table.
Independent Practice ~10 min
Add to the class Wonder Board.
Write three Wonder Board questions: one about how alleles move from parent to offspring on chromosomes, one about where new variation comes from, and one about genes versus environment. For one of them, say what data would answer it.
Closure ~5 min
We have a client, a driving question and teams. Next phase, we investigate: kernel counts first, then the sources of variation.
Exit ticket: ask one question about chromosomes or alleles that would help the seed library, and name the data that could answer it.
Teacher notes
Materials: printed client letter (generic community seed library), returned-seed table, chart paper for the Wonder Board and need-to-knows, role cards, a sample seed packet.
Setup: keep the Wonder Board and need-to-know chart posted all unit; 4.06 and 4.09 return to them.
Listen for: “the table proves pollen did it” (association, not yet cause); “big seeds have better genes” (untested assumption).
Support / stretch: provide question stems (“Does ___ change when ___?”). Stretch: look up why seed savers isolate corn varieties by distance or timing, cite your source, and write a testable question about it.