4.07 Design and Prototype: Garden Trial Plans and a Decision Matrix
set measurable criteria and constraints for the seed library’s garden trial, compare competing trial designs with a weighted decision matrix, and use statistics to predict what each design could reveal.
- I can use statistics and probability to analyze data about traits in a population.
- I can determine how environmental factors are related to how often a trait appears in a population using statistical analysis.
- I can use patterns in statistical data to predict how the distribution of a trait might change if the environment changes.
- I can explain whether the variation of a trait is caused by or just related to an environmental factor, using reliable evidence.
Phase 4: Build
Warm-Up ~5 min
Do Now. A gardener plants big saved beans in the sunny bed and small saved beans in the shady bed. The sunny plants make bigger seeds. Why can the gardener not tell whether genes or sun made the difference?
Which trial design can separate genetic from environmental effects on bean size?
Instruction ~10 min
Engineers, the brief. The seed library needs a garden trial its volunteers can run in one season to answer: do bigger saved bean seeds carry alleles for bigger seeds, or did they just grow in a better spot? Break the problem into parts (HS-ETS1-2): what to compare, how many plants, where they go, and what statistics will decide.
Class criteria (set in 4.07). A garden trial plan for the seed library must (1) separate genetic from environmental effects on a trait, (2) grow at least 30 plants per group, (3) place plants at random within each bed, (4) fit in four raised beds of 1.2 m × 2.4 m, (5) finish within one growing season, and (6) cost no more than 12 sample budget points.
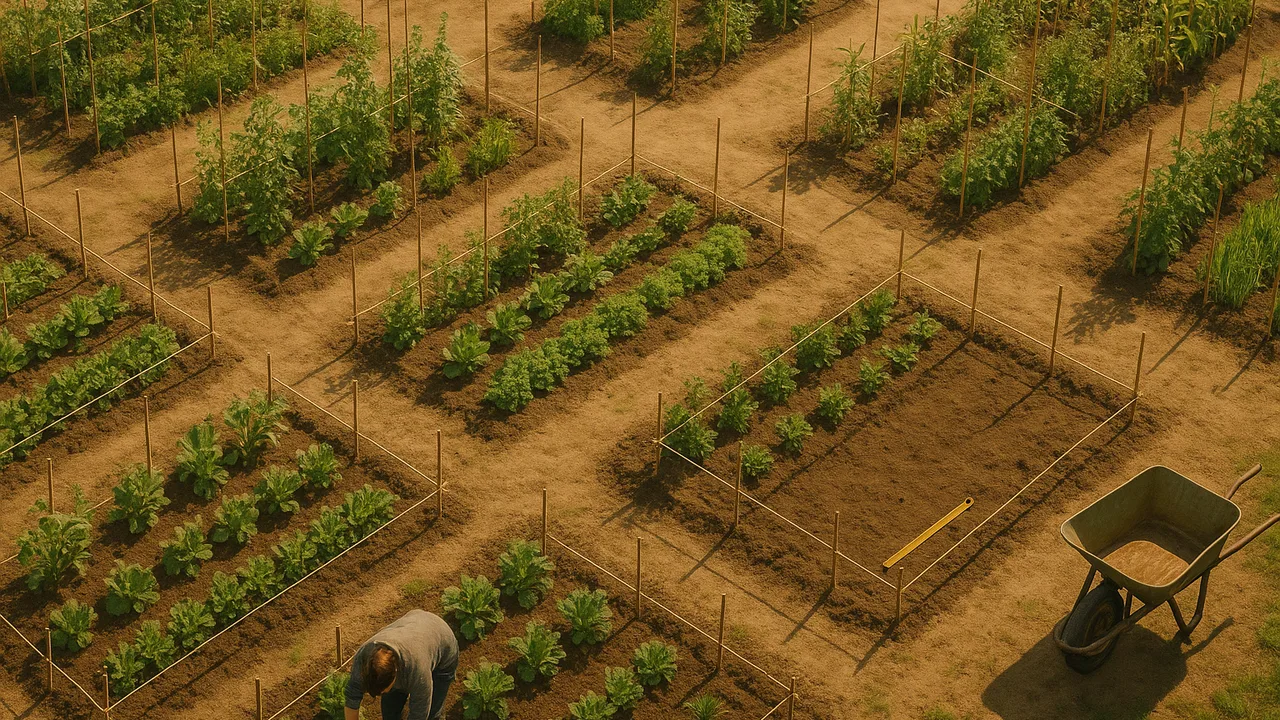
Three competing designs. Design A, One Bed Each: Lot A (seed saved from the biggest beans) in the sunny bed and Lot B (smallest beans) in the shady bed. Simple, but genes and light are confounded. Design B, Common Garden: both lots side by side in one sunny bed, 30 plants each. It tests genes but says nothing about the environment. Design C, Two by Two: both lots in a sunny bed and in a shady bed, 30 plants per group (120 total), positions drawn at random from numbered stakes.
Worked example 1: a weighted decision matrix. Score each design 1–3 on each criterion, multiply by the weight, and add.
| Criterion (weight) | A: one bed each | B: common garden | C: two by two |
|---|---|---|---|
| Separates genes from environment (3) | 1 × 3 = 3 | 2 × 3 = 6 | 3 × 3 = 9 |
| Sample size ≥ 30 per group (2) | 3 × 2 = 6 | 3 × 2 = 6 | 3 × 2 = 6 |
| Fits four beds (2) | 3 × 2 = 6 | 3 × 2 = 6 | 2 × 2 = 4 |
| Volunteer effort (1) | 3 × 1 = 3 | 3 × 1 = 3 | 1 × 1 = 1 |
| Cost (1) | 3 × 1 = 3 | 3 × 1 = 3 | 2 × 1 = 2 |
| Total | 21 | 24 | 22 |
Sample scores for teaching; your team scores its own designs. B narrowly wins on points, yet C is the only design that answers the library’s whole question. That is why the most important criterion carries the most weight, and why a team may decide to accept C’s extra effort: a tradeoff (HS-ETS1-3). A matrix guides a choice; it does not end the discussion.
Worked example 2: what the statistics could show (sample data). Suppose Design C gave these results:
| Group (sample data) | Seed lot | Bed | Plants | Mean seed length (mm) | SD (mm) |
|---|---|---|---|---|---|
| 1 | Lot A (big seeds saved) | Sunny | 30 | 15.9 | 0.6 |
| 2 | Lot B (small seeds saved) | Sunny | 30 | 15.7 | 0.7 |
| 3 | Lot A (big seeds saved) | Shady | 30 | 14.5 | 0.6 |
| 4 | Lot B (small seeds saved) | Shady | 30 | 14.3 | 0.5 |
Within the sunny bed, Lot A and Lot B differ by only 0.2 mm, less than either SD; the same holds in the shady bed. Between beds, each lot differs by about 1.4 mm, more than twice the SD. Conclusion: in these sample data, the bed (light), not the saved-seed size, explains most of the variation. Bigger saved beans did not breed bigger beans. A prediction follows: if the library moved all its beds into shade, the whole distribution of seed length would shift down by about 1.4 mm.
Worked example 3: a discrete trait in the same trial. The plan can also check corn purity. Grow 100 plants from a returned “all-purple” lot, isolated from other corn, and count the kernels on their ears. If any ears show about 1/4 yellow kernels, the lot carried hidden p alleles; a chi-square test against 3 : 1 checks the fit.
Build procedure.
- Draw your chosen design to scale on four 1.2 m × 2.4 m beds, showing spacing (about 15 cm between bean plants) and how many plants fit.
- Write the random-placement method: number every planting spot, then draw numbers from a cup (or use a random-number generator) to assign seeds.
- List what volunteers will measure, when, and with what tool.
- Write the statistics plan: means and SDs for each group, a histogram per group, and a chi-square test for any kernel-color counts.
- Price the plan with the sample price list (stakes 1 point per bed, labels 1, calipers 2, shade cloth 3, seed free from the library).
| Criterion | Target | Version 1 plan | Met? |
|---|---|---|---|
| Separates genes and environment | Yes | ||
| Plants per group | ≥ 30 | ||
| Random placement | Yes | ||
| Fits four beds | Yes | ||
| One season | Yes | ||
| Cost | ≤ 12 points |
Guided Exercises ~15 min
Score your team’s designs and plan before you build.
Independent Practice ~10 min
Predict your trial’s results.
Sketch two possible histograms for your trial: one if bean size were mostly genetic and one if it were mostly environmental. Label the means and explain which pattern of group differences would tell them apart.
Closure ~5 min
Version 1 of the trial plan is drafted. Next lesson, it faces critique and a test run on sample data.
Exit ticket: which feature of your trial plan stops genes and environment from being confounded, and why?
How confident are you that you can design a fair trial and use statistics to predict how a trait's distribution responds to the environment.
Teacher notes
Materials: bed outline templates to scale, sample price list, numbered stakes and a cup of numbers for the randomization demo, calculators, rubric copies.
Timing: about 15 minutes to score designs, 25 minutes to draft plans and statistics, 10 minutes to check against the criteria.
Listen for: designs that confound lot with bed; “bigger samples are always too much work”; matrices filled in to justify a favorite.
Support / stretch: give a pre-drawn matrix and a two-by-two grid. Stretch: add a third seed lot and work out whether the plan still fits four beds at 30 plants per group.