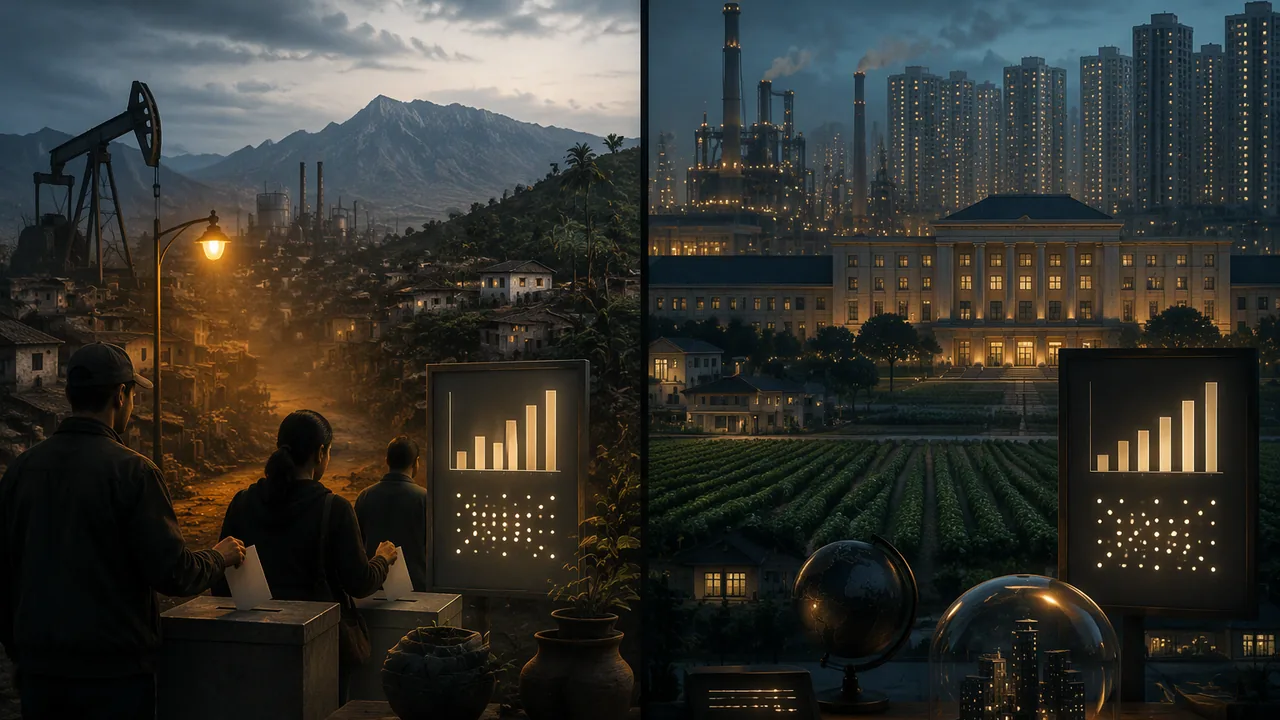
describe the recent history of Mexico and China — political systems, key leaders, economic reforms, natural features, resources, religious issues and population — and use growth and poverty data to test claims about their economic change.
Instruction
Mexico and China both changed dramatically after about 1980 — but along very different paths. Comparing them teaches you to separate economic change from political change.
Mexico: from one-party rule to competitive democracy. For 71 years (1929-2000), one party — the Institutional Revolutionary Party (PRI) and its predecessors — won every presidential election, through patronage, control of unions and, at times, fraud and repression, as in the killing of student protesters at Tlatelolco in Mexico City in October 1968. A debt crisis in 1982 pushed Mexico to open its economy. The North American Free Trade Agreement (NAFTA) took effect on 1 January 1994, linking Mexico’s economy tightly to the United States and Canada; factories (maquiladoras) grew along the border. The same day, the Zapatista uprising in the southern state of Chiapas protested the poverty and exclusion of Indigenous communities. Electoral reforms created an independent election authority, and in 2000 Vicente Fox of the National Action Party won the presidency — the first peaceful transfer of power to an opposition party in modern Mexican history. Since then, power has changed hands between parties several times; in 2024 Claudia Sheinbaum became Mexico’s first woman president. Major challenges remain: violence linked to drug trafficking cartels, corruption, inequality between the industrial north and poorer south, and debates over the independence of courts. NAFTA was replaced by the United States-Mexico-Canada Agreement (USMCA) in 2020.
Natural features and resources: mountain ranges (the Sierra Madre), a dry north and tropical south, and oil, nationalized in 1938. Religion: a majority Catholic country with a constitution that separates church and state. Population and migration: about 130 million people. Millions of Mexicans have migrated to the United States; money sent home by migrants (remittances) is one of Mexico’s largest sources of foreign income.
China: economic opening without political opening. After Mao’s death, Deng Xiaoping launched “reform and opening” in 1978: peasant families could farm their own plots and sell surplus crops; Special Economic Zones such as Shenzhen (1980) welcomed foreign investment; and state control of prices was loosened. China joined the World Trade Organization in 2001 and became the world’s leading manufacturing and exporting nation. According to the World Bank, China’s growth averaged almost 10 percent a year for more than three decades, and more than 800 million people rose out of extreme poverty. Politically, the Communist Party kept its monopoly, crushing the 1989 Tiananmen protests. Under Xi Jinping (party leader from 2012), control has tightened: term limits on the presidency were removed in 2018, Hong Kong’s freedoms were curtailed by a 2020 national security law, and a 2022 UN human rights report found serious human rights violations against Uyghurs and other mostly Muslim groups in Xinjiang. China’s claim to Taiwan, a self-governing democracy, is a major source of international tension.
Natural features and resources: great river valleys (the Yellow and Yangzi), where most people live, mountains and deserts in the west, large coal reserves and a heavy dependence on imported oil. Population: about 1.4 billion; India overtook China as the most populous country in 2023, according to the UN. The one-child policy (1980-2015) slowed growth, and China’s population is now aging and shrinking.
Worked example: what does 10 percent a year mean? (RST.9-10.7, HI.6) Growth compounds. After one year, output is 1.10 times its starting level. After ten years it is 1.1010 ≈ 2.59 times. After thirty years, 1.1030 ≈ 17.4 times. A handy shortcut, the “rule of 70,” says a quantity growing at r percent a year doubles in about 70 ÷ r years — at 10 percent, about every 7 years. Now weigh costs against benefits: rapid growth lifted hundreds of millions out of poverty, and it also brought severe air and water pollution and wide inequality between coastal cities and the interior.
📖 Read for this lesson
The reading opens over the lesson; close it to come back to exactly where you were. The checks below draw on it.
Formative check
Work through these before moving on. They are not graded — they tell you whether the standard below has landed yet.
What made Mexico’s 2000 presidential election historic?
An economy grows 10 percent a year for 30 years. About how many times larger is it at the end?
China’s economic reforms after 1978 were accompanied by a comparable opening of its political system to competing parties.
Complete a comparison table for Mexico and China: political system, key leaders since 1980, major reforms, natural features, resources, religion, population and one international relationship. Then, using the rule of 70 and the World Bank series in this lesson’s reading, write a paragraph weighing one benefit and one cost of rapid economic growth in one of the two countries, citing the indicator code and the year.
How confident are you that you can describe the recent history of Mexico and China and use data to reason about their economic change?
Practice
Work these on paper or in your notebook, then open Check your answer. Aim for all of Fluency and Application; try at least one Challenge.
Printable version: this unit’s practice workbook (PDF)
Fluency
Build speed and accuracy with the core skill.
- Order: (a) NAFTA takes effect; (b) Deng’s reforms begin; (c) Vicente Fox wins Mexico’s presidency; (d) China joins the WTO; (e) Tlatelolco massacre.
Check your answer
Answer: (e) October 1968 → (b) 1978 → (a) 1 January 1994 → (c) 2000 → (d) 2001.Both countries opened their economies from the late 1970s to 2001; only Mexico’s politics opened too. - If an economy grows 10 percent a year for 10 years, about how many times larger is it? Use the rule of 70 to estimate its doubling time.
Check your answer
Answer: 1.1010 ≈ 2.59, so about 2.6 times larger. Rule of 70: 70 ÷ 10 = about 7 years to double.Compound growth multiplies each year’s output by 1.10; the rule of 70 is a quick estimate.
Application
Use the skill in context. Show your reasoning.
- Sourcing: the lesson says, “According to the World Bank, China’s growth averaged almost 10 percent a year for more than three decades.” Why attribute the figure, and what other kind of evidence would you want?
Check your answer
Answer: Attribution lets readers judge the source and check it; the World Bank is an international institution with published data and methods, but Chinese official statistics underlie many figures. Other evidence: independent estimates, household surveys, or data on pollution and inequality that growth figures do not show.A strong answer explains why attribution matters and names evidence for what the figure leaves out. - Compare Mexico and China since about 1980: in what way did both change, and in what way did they differ?
Check your answer
Answer: Both opened their economies to world markets (Mexico through NAFTA; China through Special Economic Zones and WTO membership). Mexico also opened its politics — the PRI lost the presidency in 2000 after 71 years — while China’s Communist Party kept its monopoly on power.A strong answer names the similarity, the difference, and at least one reason for the difference. - Cause or sequence? “NAFTA took effect on 1 January 1994, and the Zapatista uprising began the same day.” Is there a link?
Check your answer
Answer: Yes, in part: the Zapatistas chose the date to protest the poverty and exclusion of Indigenous communities in Chiapas, which they believed free trade would worsen. The deeper causes were long-standing inequality and exclusion.A strong answer separates the timing (a deliberate symbol) from the underlying causes.
Review
Keep earlier skills sharp.
- Review (Unit 3): which Chinese leader, twice purged under Mao, began ‘reform and opening’ in 1978?
Check your answer
Answer: Deng Xiaoping.A strong answer connects Deng’s reforms to the upheavals of the Mao years studied in Unit 3.
The Numbers Behind the Comparison: Chinese Growth and Poverty Data, and How to Check Them
World Bank, ‘The World Bank in China – Overview’; World Development Indicators NY.GDP.MKTP.KD.ZG, SI.POV.DDAY and SP.POP.TOTL, retrieved 23 September 2026 · CC BY 4.0
Why this reading. Lesson 4.2 asks you to complete a comparison table for Mexico and China and then, “using the rule of 70 and one data source”, to weigh a benefit and a cost of rapid growth. The lesson gives you a worked example of compound growth but no data to work on. Here is the data, with indicator codes and licenses, so the calculation is yours and the source is citable.
A. China: the growth and the poverty figures
The World Bank, “The World Bank in China — Overview”, and World Development Indicators NY.GDP.MKTP.KD.ZG (GDP growth, annual %) and SI.POV.DDAY (poverty headcount ratio). World Bank Open Data, CC BY 4.0. Retrieved 23 September 2026.
The World Bank’s own summary: “Since 1978, the beginning of China’s reform and opening up period, GDP growth has averaged over 9 percent a year, lifting almost 800 million people out of extreme poverty and transforming China from a low-income to upper-middle-income country. Access to health, education, and other services has improved significantly over this period. By 2020, China had eradicated extreme poverty.”
| 1981 | 1990 | 2002 | 2010 | 2015 | 2018 | 2019–2022 |
|---|---|---|---|---|---|---|
| 97% | 83.1% | 47.8% | 20.6% | 2.9% | 0.7% | 0 |
A live warning about this indicator. The World Bank moved its extreme-poverty line to $3.00 a day at 2021 purchasing power parity. Older materials quote $1.90 or $2.15 at earlier PPPs. The Bank’s own metadata says: “As a result of revisions in PPP exchange rates, poverty rates for individual countries cannot be compared with poverty rates reported in earlier editions.” If you find a source giving a different figure for the same year, check which line it uses before you call it a contradiction.
B. Doing the arithmetic yourself
The GDP growth series for China (NY.GDP.MKTP.KD.ZG) runs from 1978 to 2024, 47 annual observations: 11.33 per cent in 1978, 4.96 per cent in 2024. The World Bank characterizes the period as averaging “over 9 percent a year”. Working from the series itself, the arithmetic mean of those 47 values is about 8.97 per cent and the compound annual mean about 8.93 per cent — figures we calculated, which is why we tell you so rather than presenting them as the Bank’s.
Now the rule of 70. At 9 per cent a year, output doubles in about 70 ÷ 9 ≈ 7.8 years. Over 46 years that is roughly six doublings, or about sixty times. Check it: 1.0946 ≈ 53. The rule of 70 is an approximation and it overshoots slightly at high rates — which is the point of checking an estimate against the exact calculation rather than trusting the shortcut.
C. Mexico and China: the comparison in figures
World Bank, World Development Indicators, SP.POP.TOTL, and the sources named in each row. CC BY 4.0 except where noted.
| Mexico | China | |
|---|---|---|
| Political change since 1980 | Electoral reform; first transfer of the presidency to an opposition party in 2000; further changes of party since | Economic opening from 1978; the Communist Party’s monopoly on power retained |
| Trade framework | NAFTA from 1 January 1994; USMCA from 2020 | World Trade Organization member from 2001 |
| Extreme poverty | — | 97% (1981) to 0 (2019–2022) at $3.00/day, 2021 PPP (World Bank) |
| Growth | — | “over 9 percent a year” since 1978 (World Bank) |
The comparison the lesson is really after. Both countries opened their economies within about fifteen years of each other. One opened its politics and one did not. That is the cleanest natural experiment in this course, and the data above lets you state the economic half of it precisely. Be careful with the causal claim in either direction: China’s growth without democratization does not prove that authoritarian rule causes growth, any more than Mexico’s democratization proves that trade causes democracy. Two cases cannot establish a rule — which is the fallacy the quiz in lesson 4.3 asks you to name.
Costs to weigh against the benefit. The benefit is in the table: several hundred million people out of extreme poverty inside one lifetime, which is the largest reduction in material deprivation ever recorded anywhere. The costs are real too, and for these you should look for sources of the same quality rather than asserting them: severe air and water pollution, wide inequality between coastal cities and the interior, the human consequences of the one-child policy (1980–2015), and, in Mexico, violence associated with drug trafficking and the displacement of small farmers after 1994. A paragraph that gives the benefit a sourced number and the cost only an adjective is not weighing anything.
Sources: The World Bank in China: Overview (worldbank.org); GDP growth (annual %), China (World Bank Open Data, CC BY 4.0) (data.worldbank.org); Poverty headcount ratio at $3.00 a day (2021 PPP), China (World Bank Open Data, CC BY 4.0) (data.worldbank.org)