3.08 Designing the Buffering Fix and the Monitoring Plan
design, test and improve a dose of sodium carbonate or bicarbonate that protects shell-building in model intake water, plan how the hatchery should monitor its intake, and use my model to explain how human activity is changing the hatchery’s water.
- I can use evidence from a computational model to explain how human activities might change the relationships between Earth systems.
- I can use a computational model to explain how at least two Earth systems are connected.
- I can describe how changes in one Earth system can cause changes in another system, using examples from the model.
- I can identify and explain the limitations of my carbon cycle model in representing all of Earth’s carbon.
Phase 4: Build
Warm-Up ~5 min
Do Now. Sodium carbonate, Na2CO3, and sodium bicarbonate, NaHCO3, are both bases. Write the reaction of each with H+ and predict which raises pH more per mole.
How many moles of H+ can one mole of carbonate ion take up on the way to carbonic acid?
Instruction ~10 min
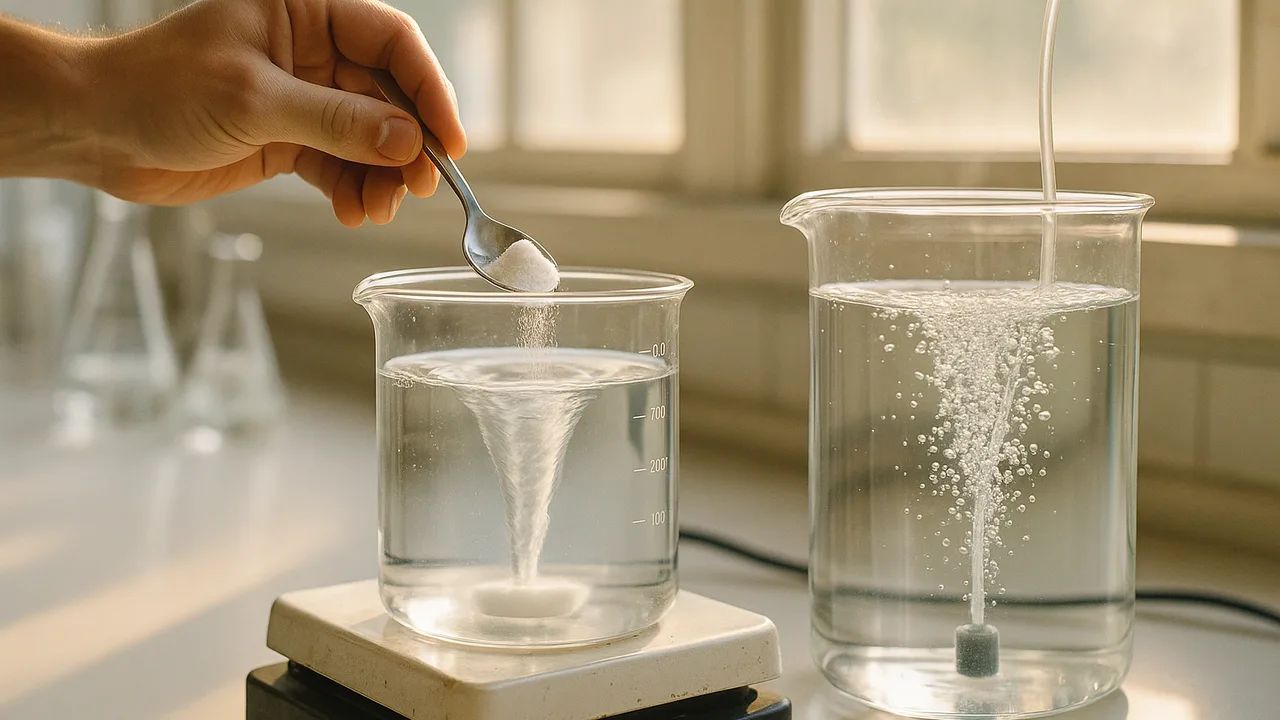
The design problem. On bad-water days the hatchery’s intake has too much dissolved CO2, too little carbonate and an Ω too low for larvae. Three concepts are on the table: A, dose sodium carbonate; B, dose sodium bicarbonate; C, bubble air through the water to strip out some CO2, then add a smaller dose. Each team tests one concept on 1.00 L of model intake water (artificial seawater with seltzer added, about pH 7.2, sample), then shell chips sit in the treated water for 48 hours.
The hatchery’s criteria and constraints (class version).
| Requirement | Type | Target |
|---|---|---|
| Larval tank water pH | Criterion | 7.9 to 8.3 after treatment, never above 8.4 |
| Shell chip mass loss in treated water over 48 h | Criterion | No measurable loss (under 0.5%) |
| Dosing chemical per liter of model intake water | Constraint | No more than 20 mL of 0.10 M solution |
| Time to treat and check one batch | Constraint | 15 minutes or less |
| Chemicals used | Constraint | Food-grade sodium carbonate or sodium bicarbonate only; nothing toxic to larvae |
| Monitoring | Criterion | Detects a bad-water day before larvae are exposed |
The chemistry of each concept. Carbonate takes up H+ and also reacts directly with dissolved CO2: CO32− + CO2 + H2O → 2HCO3−. Only the carbonate left over raises Ω, so the dose must exceed what the extra CO2 consumes, and too much can push pH past 8.4. Bicarbonate adds alkalinity more gently: it raises pH less per mole and is hard to overdose, but it needs more chemical. Stripping CO2 with air shifts CO2(aq) → CO2(g) (Henry’s law in reverse) and raises pH without adding anything, but it is slow and only works down to the air’s own CO2 level.
Worked example 1: scaling the dose. Ana’s team (concept A) reached pH 8.0 in 1.00 L of model water with 5.0 mL of 0.10 M Na2CO3 (sample): 0.10 mol/L × 0.0050 L = 5.0 × 10⁻⁴ mol per liter. For a 10,000 L larval tank: 5.0 × 10−4 × 10,000 = 5.0 mol, and 5.0 mol × 105.99 g/mol = 530 g of sodium carbonate. The same pH with bicarbonate took 14.0 mL of 0.10 M NaHCO3 (sample), 1.4 × 10⁻³ mol/L, which scales to 14 mol × 84.01 g/mol = 1.2 kg. Their bench model water is far more CO2-rich than real upwelled water, so a real hatchery would need a much smaller dose, found by testing its own water: a limitation the brief must state.
Worked example 2: a monitoring rule. Kofi’s team studied a week of sample intake readings. Before each bad-water day, intake temperature fell by 2–3 °C within half a day (cold, upwelled water arriving), and pH fell from about 8.0 to 7.6 over the next hours. Their rule: log pH and temperature every 15 minutes; if temperature drops more than 2 °C in 12 hours or pH falls below 7.8, fill tanks only from treated water; check alkalinity by titration (3.05) once a day. Plankton photosynthesis lowers CO2 during daylight, so they added: on a warning day, draw intake water in the afternoon, when pH is highest.
Gallery critique. Post your dose data, chip results and monitoring rule. Visitors leave I like…, I wonder… and What if… notes that cite a number or a reaction. Use them to build version 2.
Human activity in the picture. Your 3.07 model says the global surface ocean loses about 0.03 pH unit between now and 2050 under constant emissions. Upwelled water starts lower, so the same global shift pushes more days below the hatchery’s threshold. The fix treats a symptom on site; only lower emissions change the trend. Say both in the brief.
Guided Exercises ~15 min
Use your bench data and the critique notes you received.
Independent Practice ~10 min
Run version 2 and complete the comparison table: pH after treatment, chip mass loss, dose, time, chemical used.
Compare version 1 and version 2 on every criterion. Which criterion improved most, and what did you give up to get it?
Use your 3.07 model and today's data to explain, in one paragraph, how a change in the atmosphere (more CO2) is changing the hydrosphere and, through it, the biosphere at the hatchery.
🔎 Mini case study: Hatcheries on an upwelling coast, and the instruments that saved them ~8 min
In the late 2000s, several large oyster hatcheries on a cold, upwelling coast of the Pacific saw larval production collapse for months at a time. Disease was suspected first. Then hatchery owners began working with ocean chemists, who installed instruments that measured the carbon chemistry of the intake water continuously.
The data showed that larval failures matched days when upwelled, CO2-rich water reached the intake and aragonite saturation fell low; research at one hatchery found larvae grew poorly when Ω for aragonite dropped below about 1.5. Hatcheries responded the way your teams did: they monitored intake chemistry in real time, drew water when it was least corrosive (often in the afternoon, after plankton photosynthesis had removed CO2), and added sodium carbonate to raise saturation. Production recovered, and the monitoring network the work started still tracks coastal ocean chemistry today.
Think about it: Which of our class criteria match what these hatcheries did, and which monitoring measurement should our client add first?
Closure ~5 min
Version 2 is tested and justified. Next phase, you write the water chemistry brief and present to the hatchery.
Exit ticket: in two sentences, explain why your fix protects this season's larvae but cannot stop the trend in your model.
Teacher notes
Materials (per team): 1.00 L of model intake water (artificial seawater at about 35 g/L aquarium salt, mixed with about 200 mL of fresh seltzer just before class; check that it reads near pH 7.2), 0.10 M Na2CO3 and 0.10 M NaHCO3 made by the teacher, 10 mL graduated pipets or syringes, a pH meter, an aquarium air pump with airstone (concept C), shell chips and a 0.01 g balance, timers, sticky notes in three colors, goggles and gloves.
Timing: critique 15 minutes, version 2 build and test 25 minutes, write-up 10 minutes. Chips soak 48 hours; reweigh in 3.09.
Listen for: “more is always better” (overshooting pH stresses larvae too); changes with no reason; “the fix solves acidification.”
Support / stretch: provide a dose-scaling frame (mol/L × tank volume × molar mass). Stretch: estimate the yearly chemical cost if the hatchery treats one 10,000 L tank on 60 bad-water days, using a supplier price you look up and label.