1.02 Project Brief and Wonder Board: The Weather Station’s Balloon Launch
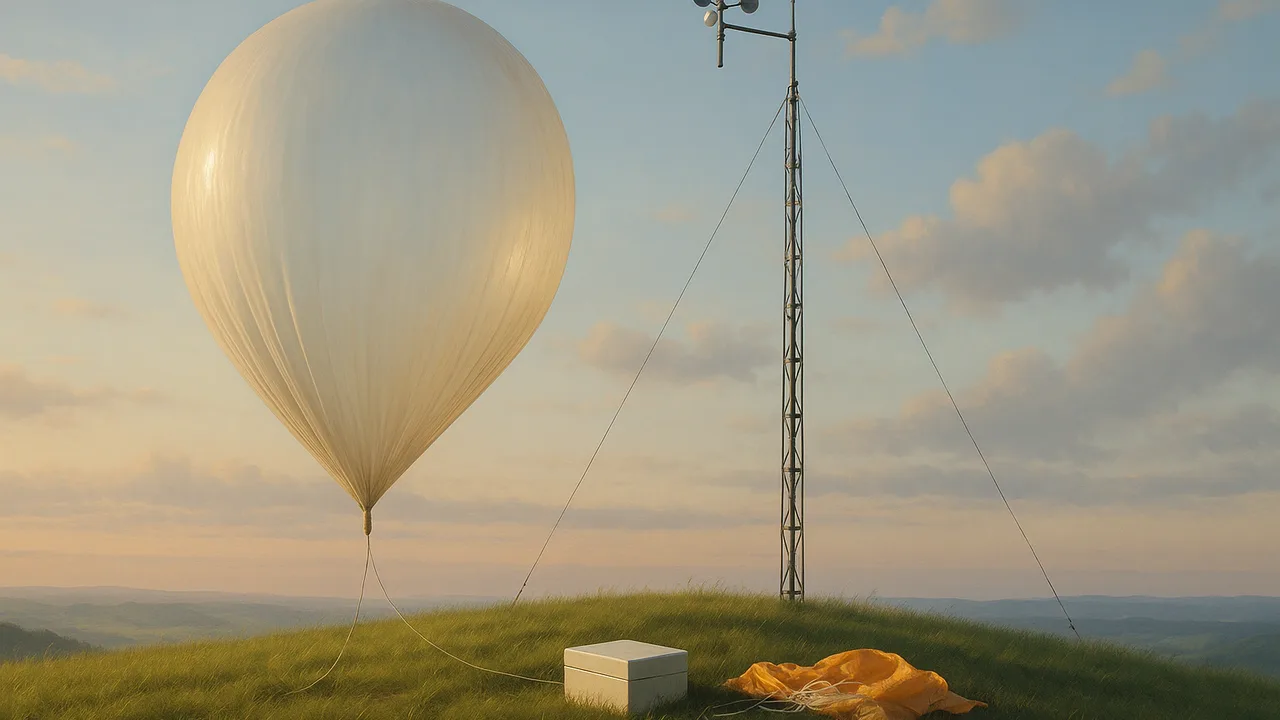
Up, Up and Pop: A Launch Brief for a Community Weather Balloon
How can a model of tiny, fast-moving particles explain why a gas expands, shrinks and cools, and how can that model help a volunteer weather station plan how much helium to use, how high its balloon will climb, and how to keep its payload battery working in the cold?
The mystery: A sealed bag of chips bought at the bottom of a mountain road is puffed up like a pillow by the time the car reaches the top. A party balloon left in a freezer overnight comes out wrinkled and small, then slowly fills out again as it warms on the counter. Nothing was added to the bag or the balloon.
Questions we will figure out together in this unit:
- Why does a sealed bag puff up on a mountain road?
- Why does a balloon shrink in the freezer and come back when it warms?
- How much bigger does a balloon get at 10 km, 20 km, 30 km?
- Why does a weather balloon pop instead of floating forever?
- How much helium does it take to lift a 1 kg payload?
- Why is it so cold up there if it is closer to the Sun?
- Why do helium party balloons go flat faster than air-filled ones?
- How do you keep a battery warm at −55 °C with no heater?
explain the weather station’s request, read standard-atmosphere data for pressure and temperature with altitude, and turn our questions into need-to-knows for the launch brief.
- I can develop models that identify and describe all parts of a system and its surroundings, showing how energy flows between them.
- I can clearly represent both macroscopic (large-scale) and molecular/atomic (small-scale) views of a system in my models.
- I can show in my models how energy appears in different forms at both the macroscopic scale (like motion, sound, light, thermal energy, potential energy, or energy in fields) and the molecular/atomic scale (like kinetic energy of particles, potential energy from positions in fields, and energy in fields).
- I can describe how changes in the positions of objects in gravitational, magnetic, or electrostatic fields affect the energy stored in those fields.
- I can explain that thermal energy includes both the kinetic and potential energy of particle vibrations in solids or molecules, and the kinetic energy of freely moving particles in liquids and gases.
- I can describe how the total energy of a system and its surroundings is conserved at both the macroscopic and molecular/atomic levels.
Phase 1: Spark
Warm-Up ~5 min
Do Now. Weather balloons are launched every day around the world. Write how high you think one can climb before it pops, and what you think happens to its size on the way up. Give a reason.
As a sealed balloon rises through the atmosphere, the air pressure outside it…
Instruction ~10 min
Meet the client. A community weather station run by volunteers has written to our class. Its members keep a rooftop station that logs temperature, humidity, wind and pressure, and they share the data with local schools. Now they want to launch a high-altitude latex weather balloon filled with helium, carrying a small sensor package (the payload) that records temperature and pressure on the way up and sends its position by radio. The payload drops back on a parachute after the balloon bursts. The station asks for a launch brief that answers four questions:
- How much helium should go into the balloon (volume and mass)?
- How big does the balloon get as it rises?
- Roughly at what altitude will it burst?
- Why does the payload’s battery need insulation, and what design works?
Every answer must be explained with the particle model: energy as the motion and relative position of particles.
Driving question. How can a model of tiny, fast-moving particles explain why a gas expands, shrinks and cools, and how can that model help the station plan its helium, its flight and its battery protection?
The atmosphere the balloon flies through. Scientists and engineers use the International Standard Atmosphere, a table of typical pressure and temperature at each altitude. Real days differ a little, but the pattern holds. Pressure falls steadily: by 5 km it is about half of sea level, and by 30 km about 1%. Temperature falls by about 6.5 °C per kilometer up to about 11 km, stays near −56.5 °C, then slowly rises in the upper stratosphere.
| Altitude (km) | Pressure (kPa) | Temperature (°C) | Temperature (K) |
|---|---|---|---|
| 0 (sea level) | 101.3 | 15.0 | 288 |
| 3 | 70.1 | −4.5 | 269 |
| 5 | 54.0 | −17.5 | 256 |
| 10 | 26.5 | −50.0 | 223 |
| 20 | 5.5 | −56.5 | 217 |
| 25 | 2.5 | −51.5 | 222 |
| 30 | 1.2 | −46.5 | 227 |
Worked example 1: reading the table. Keanu found that at 10 km the pressure is 26.5 kPa. He divided: 26.5 ÷ 101.3 = 0.26, so only about a quarter as many air-particle hits per square meter each second as at sea level. He noted: “The helium inside will push the rubber outward until it matches that. The balloon must get bigger.” That is a need-to-know: how much bigger?
Worked example 2: a temperature need-to-know. Lucia read −56.5 °C at 20 km. “If the air is that cold, the gas particles near the payload are moving slowly. How does a warm battery lose energy to slow air particles, and how fast?” Her wonder became a need-to-know about energy transfer between a system (the battery) and its surroundings (the cold air).
Breaking the problem down. Engineers split big problems into sub-problems (HS-ETS1-2). Ours: (a) find the moles and mass of helium for the fill; (b) predict balloon volume at each altitude; (c) compare that volume with the balloon’s rated burst size; (d) keep the battery warm enough; (e) stay under the payload mass limit and fly safely. This unit tackles all five, one lab at a time.
Team roles. Teams of four rotate weekly: Flight Lead (keeps the team on the question), Data Analyst (tables, graphs, calculations), Lab Manager (materials and safety checks) and Communicator (shares findings and questions with the station’s volunteers).
Guided Exercises ~15 min
Use the standard-atmosphere table and the station’s four questions.
Independent Practice ~10 min
Start your launch notebook and the team charter.
Graph pressure (kPa) against altitude (km) from the table. Describe the shape of the curve in two sentences and explain it with the particle model: why are there fewer collisions per square meter higher up?
Add two questions to the Wonder Board: one about gas particles, one about the launch.
Closure ~5 min
We know the client, the driving question and the atmosphere the balloon will fly through. Next phase, we measure how gases respond to temperature and pressure in the lab.
Exit ticket: use the table to predict whether the balloon will be bigger or smaller at 10 km than at launch. Give one reason from pressure and one from temperature, and say which you think wins.
Teacher notes
Materials: the client letter (generic, on letterhead you design), the standard-atmosphere table, graph paper, role cards, chart paper for the Wonder Board, a photo of a weather balloon launch and an empty latex balloon to pass around.
Setup: keep the Wonder Board posted all unit; 1.06 and 1.09 return to it. The station is fictional. Real launches must follow local aviation rules (payload limits, notifying the aviation authority); mention this as a constraint without naming a specific agency.
Listen for: “it gets colder because there is less air” (partly; the cooling of rising air comes from expansion, which we model in 1.06); “the balloon pops because it gets too cold.”
Support / stretch: give a sentence frame for need-to-knows (“We need to know ___ so that we can ___”). Stretch: from the table, estimate the altitude where pressure is one quarter of sea level (about 10 km).