build two genuinely different prototypes for one problem, test them with users against written criteria, and draw a conclusion supported by the test results.
Instruction
Why two. If you build only one design, the only question you can ask is “Is this good?” and the answer is almost always “sort of.” If you build two genuinely different approaches, you can ask “Which works better for this audience, and why?” That comparison produces evidence, and it often reveals that the best final design combines strengths of both.
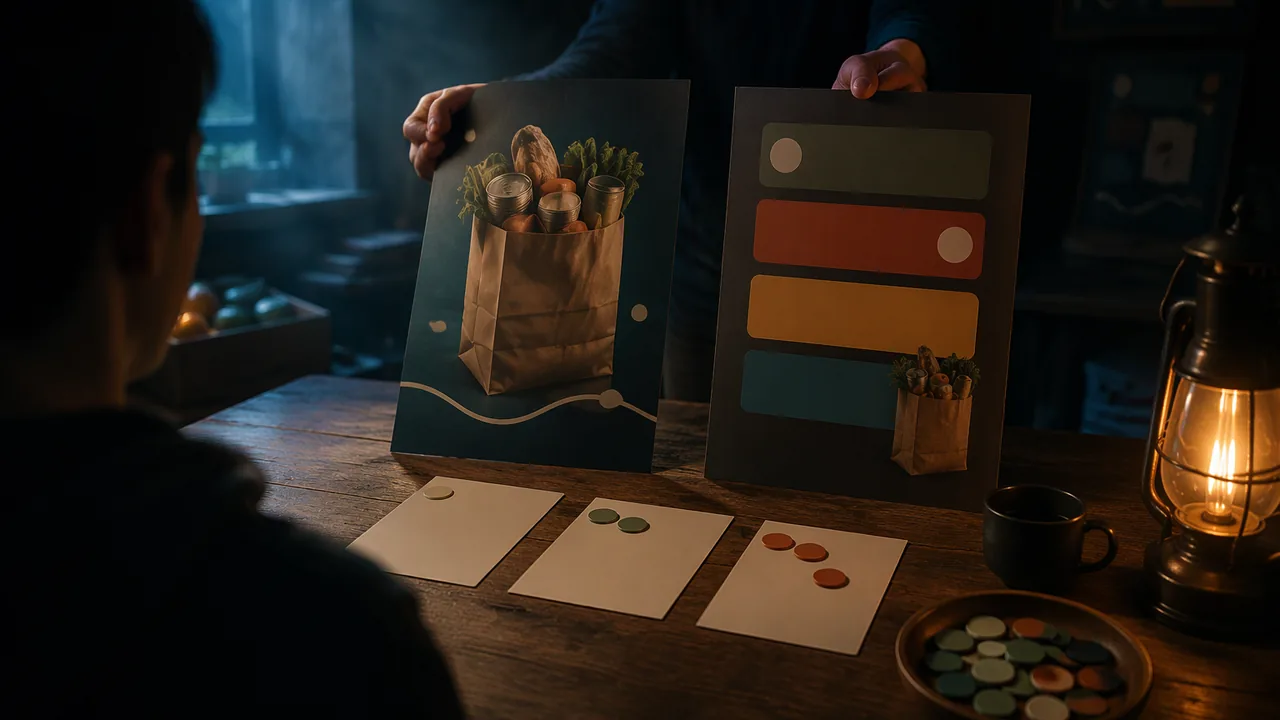
Genuinely different. Two versions of the same layout in different colors are not two approaches. Different approaches differ in concept or strategy: for the food bank, approach A might be image-led (a single bold visual metaphor, very few words), while approach B is message-led (a large, direct headline such as “Saturdays. Friends. Service hours.” with a small supporting image). Each is a real bet about what will move this audience.
Prototype fidelity. A prototype only needs enough detail to test the question you are asking. For a poster, a clean digital rough with real headline text and placeholder images is usually enough. Do not polish either version before testing, because polish makes you attached to your work and wastes time on a version you might drop.
Write the criteria first. Before you test, write down what “works” means, drawn from your problem statement. For example: (1) Message: a viewer can say what the poster is asking them to do. (2) Details: a viewer can find the day and time within ten seconds. (3) Appeal: a viewer from the audience says they would stop and look. Writing criteria first stops you from deciding afterward that whatever your favorite did well was what mattered. This is how designers write assessment rubrics for a product.
Simple tests you can run. Five-second test: show a version for five seconds, hide it, and ask, “What was that about? What were you asked to do?” Task test: show the version and ask the person to find a detail, timing how long it takes. Preference with reasons: show both side by side and ask which they would stop for and why. Alternate which version each person sees first, because people tend to react differently to whatever they see first.
Worked example (illustrative data). Suppose a designer tests each version with 12 people from the audience. For the five-second test, 9 of 12 correctly name the action for version B, and 5 of 12 for version A. That is 9 ÷ 12 = 75% against 5 ÷ 12 ≈ 42%. For the task test, the median time to find the Saturday shift is 4 seconds for B and 11 seconds for A. On preference, 7 of 12 choose A as the one they would stop for. A careful conclusion: “Version B communicates the action and details more clearly (75% against 42% in the five-second test, median 4 against 11 seconds to find the shift), but more testers were drawn to A’s image. The revision should keep B’s headline and hierarchy and try A’s visual metaphor at a smaller size.”
Be honest about limits. Twelve testers are a small sample and may not represent everyone in the audience, and the three or four family members or adults you can test with are smaller still. Say so. Test results are evidence, not proof, and the job of your written analysis is to reason from them fairly, including the evidence that favors the version you did not choose.
Manage your time. Plan the workshop: 40 minutes to build both prototypes, 30 minutes to test, 20 minutes to analyze. Build both to the same level of finish so the test is fair.
📖 Read for this lesson
The reading opens over the lesson; close it to come back to exactly where you were. The checks below draw on it.
Formative check
Work through these before moving on. They are not graded — they tell you whether the standard below has landed yet.
If 9 of 12 testers name the action correctly, the success rate is %; if 5 of 12 do, it is about %.
Why should you write your criteria before running the tests?
Two versions of the same layout in different colors count as two different approaches.
Write a three-sentence claim about which of your prototypes worked better. Cite at least two numbers from your results table and name one limit of your test.
How confident are you that you can test two prototypes against criteria and reach a conclusion supported by the results?
Prototype Test Kit: Two Described Prototypes, Criteria, a Test Script and 12 Constructed Results with Calculations
SLS original test kit; all data constructed for teaching · SLS original
Why this reading. The workshop asks you to build two prototypes, test them against written criteria and reason from the results. This kit supplies a described pair of prototypes for the food bank problem, the criteria, the test script, a full set of results from 12 constructed testers, and the calculations, so you can practice the analysis before you use your own data. SLS original; the data are invented for teaching and are not a finding about real posters.
The two prototypes (letter size, black and white)
Version A, image-led. A large drawing of a crate of cans, filling the top two thirds, with the words “Build Saturday” small in the lower right and the scan code at bottom left. Version B, message-led. A 60-point headline, “Saturdays. Friends. Service hours.” across the top third; a small crate drawing; and beneath, at 24 pt, “Ages 15+ welcome. Sat. 8:30-11:30 a.m. Scan to sign up.”
Criteria written first, from the problem statement
- Message: at least 75 percent of testers can say what the poster asks them to do after five seconds.
- Details: the median time to find the Saturday shift is 10 seconds or less.
- Appeal: at least 50 percent say they would stop and look.
Test script
Five-second test: “Look at this for five seconds. What was it about? What were you asked to do?” Task test: “Find the day and time,” timed in seconds. Preference: “Which would you stop for?” Six testers see A first, six see B first.
Results, 12 testers (constructed)
| Measure | A | B |
|---|---|---|
| Named the action | 5 of 12 | 9 of 12 |
| Seconds to find the shift (sorted) | 6, 8, 9, 10, 11, 11, 11, 12, 14, 15, 18, 22 | 2, 3, 3, 3, 4, 4, 4, 5, 5, 6, 7, 9 |
| Would stop for it | 7 of 12 | 5 of 12 |
Calculations
Named the action: A 5 ÷ 12 = 41.7 percent; B 9 ÷ 12 = 75 percent; a 33-point gap. Median time: with 12 values, the median is the mean of the 6th and 7th; A: (11 + 11) ÷ 2 = 11 s; B: (4 + 4) ÷ 2 = 4 s. Means as a check: A 147 ÷ 12 = 12.25 s; B 55 ÷ 12 = 4.58 s. Would stop: A 7 ÷ 12 = 58.3 percent; B 5 ÷ 12 = 41.7 percent.
Against the criteria
| Criterion | A | B |
|---|---|---|
| 1 Message (75 percent) | 41.7: fails | 75: meets |
| 2 Details (median at most 10 s) | 11 s: fails | 4 s: meets |
| 3 Appeal (50 percent) | 58.3: meets | 41.7: fails |
A careful three-sentence claim
“Version B communicated the action better (75 versus 41.7 percent) and got the shift found faster (median 4 versus 11 seconds), but 7 of 12 testers said they would stop for A’s image. The final design should keep B’s headline and hierarchy and test A’s crate at a smaller size. Twelve testers are a small sample of the students this poster is for, so this is evidence, not proof.”
Testing on your own
You will probably test with three or four family members or adults you know, arranged with a parent. With 3 testers, each person is 1 ÷ 3 ≈ 33 percent of the result, so one changed answer moves a percentage by 33 points; report counts (“2 of 3”) rather than percentages, and say the sample is very small. If you have fewer than three testers, add a structured self-test: put both versions away for a day, then have someone (or a timer) show you each for five seconds, write what it asked you to do, and time how long you take to find the day and time. You know your own designs, so a self-test is the weakest evidence; label it.
Not two approaches
A version B with a green headline instead of black is a variation of B, not a second approach. Two approaches differ in strategy: here, image-led versus message-led.