analyze data on slope stability and argue, with evidence, how one change to Earth’s surface, such as clearing a forest, creates feedbacks that change other Earth systems.
Instruction
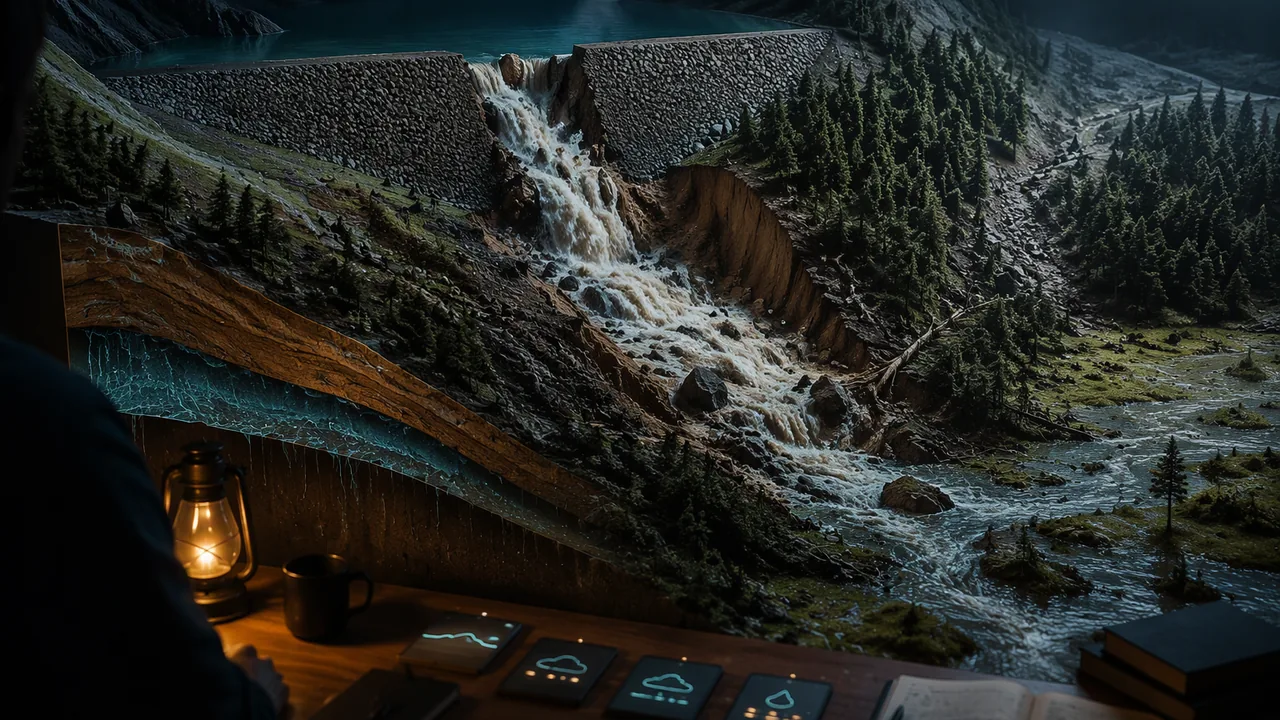
A human impact first. At about 5:16 in the morning on December 14, 2005, a 680-foot-wide section of the embankment around the Taum Sauk upper reservoir, on top of Proffit Mountain in Reynolds County, failed suddenly. About 1.5 billion gallons of water rushed down the mountainside, through Johnson’s Shut-Ins State Park and into the East Fork of the Black River. The U.S. Geological Survey estimated a peak flow of 289,000 cubic feet per second on the mountainside and modeled water speeds of up to 51 feet per second. The flood affected about 180 acres of forest, scoured the mountainside, left enormous quantities of rock, soil and trees in the park, and heavily damaged a rare groundwater-fed wetland (a fen) whose recovery is still uncertain. The water ripped the park superintendent’s home from its foundation and injured four people; the Association of State Dam Safety Officials concluded that loss of life was averted by chance alone. The reservoir had overfilled during the final minutes of a pumping cycle, and water pouring over the top of its rockfill wall breached it. Scientists and engineers study failures like this so that the next structure, and the next slope, holds.
Forces on a slope. Any mass on a slope feels gravity. Part of its weight pulls it downhill (the driving force, proportional to sin θ, where θ is the slope angle); part presses it into the slope (proportional to cos θ), and that pressing produces friction that resists sliding. Engineers compare them with a factor of safety: FS = resisting force / driving force. For simple friction with coefficient μ, FS = μ cos θ / sin θ. When FS > 1 the slope holds; when FS < 1 it fails.
Worked example. Soil with μ = 0.6 on a 25° slope: FS = 0.6 × cos 25° / sin 25° = 0.6 × 0.906 / 0.423 ≈ 1.29. Stable. Now saturate the soil. Water in the pores pushes the grains apart and carries some of the weight, lowering the pressing force. If pore water reduces it by 40%, FS = 1.29 × 0.6 ≈ 0.77, and the slope fails, though its angle never changed. The steepest stable angle for dry material with μ = 0.6 is the angle whose tangent is 0.6, about 31°. An earth or rock embankment is a slope too: water pouring over its top and soaking into it attacks it in exactly these ways.
Water does two opposite things. A little water makes sand stronger: thin films between grains pull them together by surface tension, which is why damp sand builds steep sandcastle walls. A lot of water makes it weaker, because it fills the pores, adds weight and pushes grains apart until the mass flows like a liquid. You will measure both in the lab.
Feedbacks between systems. A feedback is a chain of cause and effect in which one change triggers changes elsewhere that come back to affect the first system. The Ozark hills show a slow one, worked out by U.S. Geological Survey scientists from old records, stream deposits and interviews with longtime residents.
- Biosphere to geosphere: settlers cleared valley-bottom forest for fields, and from the 1870s or 1880s until about 1920 timber companies cut the shortleaf pine and oak. From about 1920 to 1960 people burned the uplands every year and let livestock roam the open range, where the animals crowded into the valley bottoms and destroyed the plants on stream banks.
- Hydrosphere to geosphere: with fewer roots holding the banks and small valleys, storm runoff cut into them and released huge amounts of the cherty gravel stored there. Extreme regional floods between 1895 and 1915 came at just the wrong time.
- Geosphere to hydrosphere: the gravel moved down the stream network in slow, wave-like pulses that are still traveling; along 160 km of the Current River, gravel bars cluster in disturbed reaches a few kilometers apart. Channels filled with gravel grow wider and shallower.
- Back to the biosphere: unstable, shifting channels make it hard for streamside trees to take root again, and without them the banks stay weak, so recovery is slow. That loop is the feedback.
Your argument. Was the gravel in Ozark streams caused by the land use, by the big floods or by the steep, gravel-rich hills? A strong argument does not pick one; it shows how they interacted, with evidence for each link, and answers a counter-claim.
📖 Read for this lesson
The reading opens over the lesson; close it to come back to exactly where you were. The checks below draw on it.
Lab: Angle of Repose: Dry, Damp and Saturated Sand
Question. How does the amount of water in sand change the steepest slope it can hold?
Materials
- Dry play sand, about 1 L (dry sugar or rice also works for the dry cones)
- A paper or plastic cup with the bottom cut out (a funnel works)
- A tray or baking sheet
- A measuring cup and a spray bottle of water
- A protractor (or a printed one), a ruler and a pencil
- Paper towels
- Wear safety glasses: sand can fly when a pile collapses.
- Keep sand and water on the tray, sweep up spills at once, do not pour sand down a drain, and wash hands after the lab.
Procedure
- Stand the open cup on the tray, fill it with 250 mL of dry sand, and lift it slowly and straight up so the sand forms a cone.
- Measure the height of the cone and the radius of its base with the ruler. Compute the angle as tan⁻¹(height / radius), and check it with the protractor held against the side of the cone.
- Repeat twice more with dry sand and record the average angle.
- Mix 250 mL of sand with 25 mL of water (damp) and repeat three times. Then mix 250 mL of sand with 75 mL of water (saturated) and repeat three times.
- Build one damp cone and slowly spray water onto its top, counting sprays until it slumps. Record how it failed.
Data
| Sand condition | Water added (mL) | Height (mm) | Base radius (mm) | Angle = tan⁻¹(h/r) (°) | Average angle (°) |
|---|---|---|---|---|---|
| Dry | 0 | ||||
| Damp | 25 | ||||
| Saturated | 75 |
No sand? The reading for this lesson (Table 2) gives a complete recorded run: three cones in each condition with heights, radii and the spray-test description.
Analysis
- Claim: how does water content affect the angle of repose? Use your average angles as evidence, and explain the result with surface tension and pore pressure.
- When you sprayed water on the damp cone, how did it fail? Relate what you saw to a slope that becomes saturated in a storm.
- Use your dry-sand angle to estimate the friction coefficient of the sand (μ = tan of the angle).
- Sources of error: how do lifting speed, uneven mixing and measuring a rounded cone top affect your angles?
If you cannot do this lab in person: Choose one. Both earn full credit and answer the same four analysis questions. Option A — build the cones at home. The procedure above, with play sand, garden sand, or dry sugar or rice for the dry cones and a paper cup. Option B — the recorded run in this lesson’s reading. No materials needed. Use the reading’s Table 2 (nine cones with heights and radii, and the spray test) to compute every angle and average yourself, then answer every analysis question from those numbers and the description of how the damp cone failed.
Formative check
Work through these before moving on. They are not graded — they tell you whether the standard below has landed yet.
For dry soil with μ = 0.7, what is the steepest stable slope angle?
A slope can fail during a storm even though its angle has not changed.
Which chain best describes the feedback after Ozark forests were cleared and livestock grazed the valley bottoms?
Write a CER argument answering: ‘What put the excess gravel into Ozark streams?’ Use at least one piece of evidence from your angle-of-repose lab, one factor-of-safety calculation, and the land-use, flood and slope feedback chain. Then rebut this claim: ‘It was just the big floods of 1895 to 1915; the way people used the land had nothing to do with it.’ Finally, write the strongest objection a skeptical reader could raise against your argument and answer it, in writing or on a recording.
How confident are you that you can use slope-stability data to argue how a change to Earth’s surface creates feedbacks in other systems?
Practice
Work these on paper or in your notebook, then open Check your answer. Aim for all of Fluency and Application; try at least one Challenge.
Printable version: this unit’s practice workbook (PDF)
Fluency
Build speed and accuracy with the core skill.
- Find the factor of safety for soil with μ = 0.6 on a 20° slope (FS = μ cos θ / sin θ).
Check your answer
Answer: 1.65; stable - Find the steepest stable angle for dry sand with μ = 0.65.
Check your answer
Answer: about 33°tan θ = μ. - A sand cone is 45 mm high with a base radius of 75 mm. What is its angle of repose?
Check your answer
Answer: about 31°tan−1(45/75).
Application
Use the skill in context. Show your reasoning.
- Soil with μ = 0.6 sits on a 25° slope. Find FS when dry, and when pore water reduces the pressing force by 40%. Does the slope fail?
Check your answer
Answer: dry 1.29; saturated 0.77; it fails when saturated - Explain why damp sand holds a steeper slope than dry sand, but saturated sand slumps.
Check your answer
Answer: Thin water films pull damp grains together by surface tension; when pores fill, water pushes grains apart and adds weight, so friction drops and the sand flows. - Write the feedback chain linking forest clearing and open-range grazing in the Ozarks to gravel in the streams and back to the biosphere, naming the Earth system at each step.
Check your answer
Answer: Clearing and grazing remove streamside and valley plants (biosphere); storm runoff (hydrosphere) erodes banks and small valleys and releases stored gravel (geosphere); gravel-choked channels widen and shift (geosphere and hydrosphere); unstable channels keep streamside trees from re-establishing (biosphere), so the banks stay weak.
Challenge
Stretch problems. Expect to think before you write.
- What fraction of the pressing force must pore water remove for a slope with μ = 0.7 at 30° to reach FS = 1?
Check your answer
Answer: about 18%Dry FS = 1.212; need (1 − r) × 1.212 = 1.
Review
Keep earlier skills sharp.
- A sample starts with 100 g of an isotope whose half-life is 30 years. How much remains after 90.0 years?
Check your answer
Answer: 12.50 g90.0 years is 3 half-lives; halve 3 times. - Review (Unit 3): how many times more energy does an M7.1 earthquake release than an M6.4?
Check your answer
Answer: about 11 times101.5 × 0.7.
Taum Sauk as the USGS Measured It, the Ozark Gravel Story, and a Recorded Angle-of-Repose Run
Rydlund 2006, USGS SIR 2006-5284 (abstract); Barr 2009, USGS SIR 2009-5111 (abstract); Jacobson and Primm, Historical land-use changes and potential effects on stream disturbance in the Ozark Plateaus, Missouri, USGS Water-Supply Paper 2484 (abstract); Jacobson and Gran 1999, Gravel sediment routing from widespread, low-intensity landscape disturbance, Current River basin, Missouri (abstract); Missouri State Parks, Natural Features – Johnson’s Shut-Ins; Association of State Dam Safety Officials, Taum Sauk case study; retrieved November 6, 2026; SLS original illustrative angle-of-repose record · Public domain (works of the United States government), with Missouri State Parks and Association of State Dam Safety Officials information quoted briefly and an SLS original lab record and computations
Why this reading. The lesson’s argument asks what put the excess gravel into Ozark streams, and it must use evidence from the angle-of-repose lab, a factor-of-safety calculation and the land-use chain. The lesson’s opening event is the 2005 Taum Sauk reservoir breach. Here are both as U.S. Geological Survey scientists published them, a completed angle-of-repose run for students without sand, and every factor-of-safety figure in the lesson recomputed. Retrieved November 6, 2026.
A human impact first
The Association of State Dam Safety Officials’ case study: the flood “destroyed 281 acres of Johnson’s Shut-Ins State Park and ripped the superintendent’s home from its base. By chance alone, loss of life was averted and only four people sustained injuries.” The reservoir “failed by overtopping during the final minutes of one of its pumping cycles”, releasing its 4,300 acre-feet in 25 minutes.
Table 1. The Taum Sauk breach, December 14, 2005, as the USGS measured it
| Quantity | Value | Source |
|---|---|---|
| The structure | A 55-acre upper reservoir holding 1.5 billion gallons, built on top of Proffit Mountain about 760 feet above the floodplain of the East Fork Black River | Rydlund 2006 |
| The failure | At about 5:16 a.m., a 680-foot-wide section of the embankment “failed suddenly” | Rydlund 2006 |
| Peak flow | 289,000 ft3/s on Proffit Mountain (8,184 m3/s); 95,000 ft3/s on the East Fork Black River (2,690 m3/s) | Rydlund 2006 (indirect measurement) |
| Compared with natural floods | About 4 times the East Fork’s 100-year flood (21,900 ft3/s) and about 3 times its 500-year flood (30,500 ft3/s): 95,000 / 21,900 = 4.3; 95,000 / 30,500 = 3.1 | Rydlund 2006 |
| Speed and depth | Modeled velocities 20 to 51 ft/s on the mountainside (6.1 to 15.5 m/s) and 12 to 32 ft/s on the river; depths over 50 ft on Proffit Mountain; the water reached the floodplain in about 5.5 to 6 minutes | Rydlund 2006 |
| Damage | About 180 acres of timber affected; debris movement “extensive” down the mountain and through Johnson’s Shut-Ins State Park; “enormous quantities of rock, soil, and vegetation” deposited; very fine “rock flour” from scouring the mountainside may explain a blue-green color on the river for a year | Rydlund 2006; Barr 2009 |
| The case study’s figures | Breach 656 ft wide; peak 273,000 ft3/s; 4,300 acre-feet released in 25 minutes; 281 acres of the park destroyed; four people injured | Association of State Dam Safety Officials |
| Living things | The Johnson’s Shut-Ins fen, a wetland fed by groundwater, “was heavily damaged by the reservoir breach. It is uncertain to what extent it might recover.” | Missouri State Parks |
Note that the dam-safety case study gives a breach 656 feet wide and a peak of 273,000 ft3/s, while the USGS gives 680 feet and 289,000 ft3/s. Different teams measured in different ways; a careful account says which figure it is quoting.
The Ozark gravel story (USGS)
Jacobson and Primm (USGS Water-Supply Paper 2484) pieced together the history from records, stream deposits and oral histories:
| Period | What changed |
|---|---|
| Before settlement | Streams carried a mixed load of gravel and silty sediment; early explorers “conspicuously lack descriptions of extensive gravel bars.” |
| Early 1800s to about 1880 | Valley-bottom forest replaced by fields and pastures; wildfire suppression let woody understory grow on the uplands. |
| 1870s or 1880s to 1920 | Commercial logging of shortleaf pine for sawlogs and oak for railroad ties; clearing and road building in valley bottoms; extreme regional floods from 1895 to 1915 “probably caused initiation of moderate stream disturbance.” |
| 1920 to 1960 | Annual burning of uplands and cut-over slopes, more open-range grazing, more marginal land cultivated. Livestock concentrated in valley bottoms and “destroyed riparian vegetation in the channels and on banks”; oral histories say the gravel “came out of the runs, rather than from slopes.” |
| 1960 to 1993 | Fewer cultivated fields but more cattle; recovery helped by streamside vegetation “limited by channel instability and frequent, large floods.” |
Jacobson and Gran (1999) mapped gravel bars along 160 km of the Current River: excess gravel moves “in wave-like forms” through the basin, with smaller peaks of gravel area 1.8 to 4.1 km apart, and present-day land use is only weakly linked to where the gravel is now, because the gravel released decades ago is still traveling.
Table 2. Recorded angle-of-repose run
Constructed teaching data, not measurements of a particular student. Procedure as in the lab: 250 mL of play sand poured through a bottomless cup onto a tray, cup lifted slowly; height and base radius measured with a ruler; angle = tan−1(height / radius) and checked with a protractor. n = 3 cones per condition.
| Condition | Water added (mL) | Cone | Height (mm) | Base radius (mm) | Angle (°) | Mean angle (°) |
|---|---|---|---|---|---|---|
| Dry | 0 | 1 | 38 | 57 | 33.7 | 33.7 |
| 2 | 37 | 56 | 33.5 | |||
| 3 | 39 | 58 | 33.9 | |||
| Damp | 25 | 1 | 71 | 41 | 60.0 | 59.5 |
| 2 | 68 | 42 | 58.3 | |||
| 3 | 73 | 42 | 60.1 | |||
| Saturated | 75 | 1 | 21 | 68 | 17.2 | 17.7 |
| 2 | 23 | 70 | 18.2 | |||
| 3 | 22 | 69 | 17.7 |
The spray test: the damp cone (about 59°) took eleven sprays before its upper third slid off in one piece and spread into a low fan, and by the sixteenth spray the whole cone had slumped to a mound about 20° steep with water pooling at its edge. Read across the table: a little water made the stable angle 1.77 times as steep, surface tension in the thin films pulling the grains together; a lot of water cut it to about half the dry value (0.52), pore water pushing the grains apart and adding weight. The friction coefficient of the dry sand is tan(33.7°) = 0.67, which is the lab’s third analysis question and the μ to carry into a factor-of-safety calculation.
Every factor of safety in the lesson, recomputed
FS = μ cos θ / sin θ = μ / tan θ.
| Case | μ | θ | Computation | FS | Result |
|---|---|---|---|---|---|
| Mini-lecture, dry soil | 0.6 | 25° | 0.6 × 0.9063 / 0.4226 | 1.29 | Stable |
| Same slope, pore water removes 40% of the pressing force | 0.6 × 0.6 | 25° | 1.29 × 0.6 | 0.77 | Fails, angle unchanged |
| Steepest dry slope for μ = 0.6 | 0.6 | tan−1(0.6) | — | 1.00 | 31.0° |
| Quiz: steepest dry slope for μ = 0.7 | 0.7 | tan−1(0.7) | — | 1.00 | 35.0° |
| Lesson 4.5 example, dry | 0.7 | 30° | 0.7 × 0.8660 / 0.5000 | 1.21 | Stable |
| Lesson 4.5 example, saturated (40% loss) | 0.7 × 0.6 | 30° | 1.21 × 0.6 | 0.73 | Fails |
| The lab’s sand on a steep 30° Ozark hollow side, dry | 0.67 | 30° | 0.67 / 0.5774 | 1.16 | Barely stable |
| The same, saturated (40% loss) | 0.67 × 0.6 | 30° | 1.16 × 0.6 | 0.70 | Fails |
The chain, with the evidence at each link
| Link | Evidence |
|---|---|
| Clearing and grazing remove plants from banks and small valleys (biosphere to geosphere) | Logging to 1920; open-range livestock that destroyed riparian vegetation, 1920-60 (Jacobson and Primm) |
| Storm runoff erodes the weakened valleys (hydrosphere to geosphere) | Extreme floods 1895-1915; gravel “came out of the runs” (Jacobson and Primm) |
| Water lowers the factor of safety without changing the slope | Table 2: saturated sand stands at 17.7° against 33.7° dry; FS at 30° drops from 1.16 to 0.70 |
| Gravel travels through the network (geosphere and hydrosphere) | Wave-like gravel accumulations along 160 km of the Current River (Jacobson and Gran) |
| Recovery is slow (back to the biosphere) | Recovery aided by streamside vegetation is limited by channel instability and frequent floods (Jacobson and Primm) |
The rebuttal to “it was just the big floods”: Ozark streams had floods before settlement, yet early explorers did not describe extensive gravel bars; the USGS links the gravel to the land-use changes that weakened the valleys, with the floods of 1895-1915 as the trigger that came at a vulnerable time. The strongest honest version of the counter-claim is that the floods were extreme; the answer is that the land use is what turned extreme floods into a lasting change, and both were necessary.
Sources: Rydlund 2006, Peak discharge, flood profile, flood inundation, and debris movement accompanying the failure of the upper reservoir at the Taum Sauk pump storage facility (USGS SIR 2006-5284) (pubs.usgs.gov); Barr 2009, Effects of the upper Taum Sauk Reservoir embankment breach on surface-water quality and sediments (USGS SIR 2009-5111) (pubs.usgs.gov); Jacobson and Primm, Historical land-use changes and potential effects on stream disturbance in the Ozark Plateaus, Missouri (USGS WSP 2484) (pubs.usgs.gov); Jacobson and Gran 1999, Gravel sediment routing, Current River basin, Missouri (USGS) (pubs.usgs.gov); Association of State Dam Safety Officials, Dam Failure Case Study: Taum Sauk Dam (Missouri, 2005) (damsafety.org); Missouri State Parks, Natural Features – Johnson’s Shut-Ins (mostateparks.com)