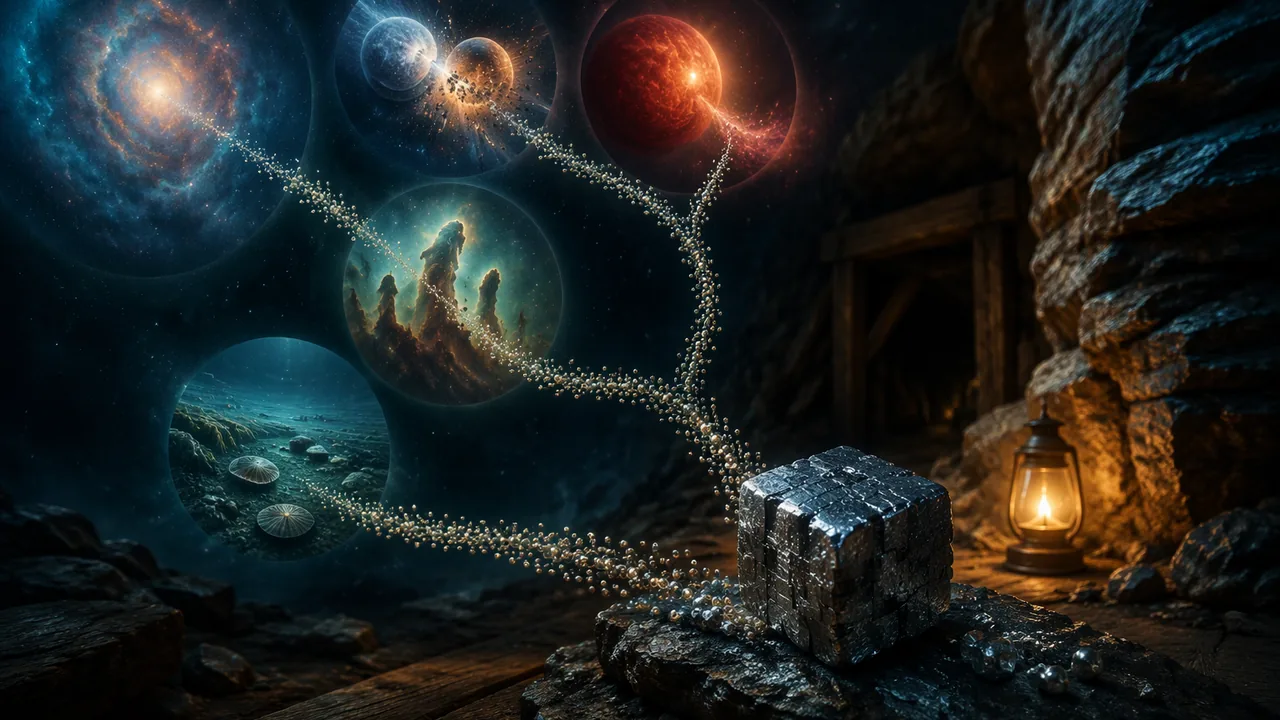
communicate a scientific explanation, supported by evidence and calculations, of how the atoms in a cube of Missouri galena came to exist.
Instruction
The question. How did the lead atoms in a cube of galena from a Viburnum Trend mine come to exist, and how do we know? Your explanation connects everything in this unit, and it has to be built from evidence, not just a story.
What a scientific explanation needs. It explains a phenomenon by a mechanism, supported by evidence, in order. For this task that means four chapters, each with a claim and evidence:
- The beginning. The Big Bang produced hydrogen and helium, not lead. Evidence: redshifts and Hubble’s law, the 2.725 K cosmic microwave background, and the roughly 75% hydrogen, 25% helium composition of the oldest stars.
- Stars as factories. Stars fuse light elements into heavier ones, releasing energy. Include one calculation: for example, the Sun converts about 4.26 × 10⁹ kg of mass to energy each second (L/c2). Explain why fusion stops at iron.
- The heavy-element events. Lead is far beyond iron, so it needs neutron capture. Most of the Galaxy’s lead is thought to come from slow neutron capture (the s-process) in aging low-mass giant stars, where the process ends at lead and bismuth. Some lead began instead as uranium and thorium, which only rapid neutron capture (the r-process) can build, in extreme events such as neutron-star mergers; evidence: the 2017 kilonova that followed GW170817. Uranium-238 decays to lead-206, uranium-235 to lead-207 and thorium-232 to lead-208. Say clearly which parts are well established and which are still debated.
- Arrival in Missouri. The enriched gas cloud collapsed into the Sun and planets about 4.6 billion years ago, and the lead was carried in Earth’s rocks. Missouri’s oldest rocks, the volcanic and granite rocks of the St. Francois Mountains, formed 1.48 to 1.45 billion years ago. A Late Cambrian sea laid down the Bonneterre dolomite around them, and about 273 million years ago (Early Permian, give or take 10 million years) hot, salty fluids moving through the buried rocks deposited galena in that dolomite, making the Viburnum Trend ore. Lead ore was found near Mine La Motte in 1720. (You will learn the rock-forming part of this story in Units 2-4; a few sentences are enough here.)
A worked example of one paragraph. Claim: “The universe began in a hot, dense state and has been expanding.” Evidence: “A galaxy whose hydrogen line appears at 671.0 nm instead of 656.3 nm has z ≈ 0.0224 and is receding at about 6,700 km/s; Hubble found that recession speed increases with distance.” Reasoning: “If all galaxies are moving apart at speeds proportional to distance, then in the past they were closer together, and running the expansion backward gives a beginning about 14 billion years ago.” Notice how the paragraph uses a number, names where it came from, and says why it matters.
Your timeline model. Build a labeled timeline from 13.8 billion years ago to today. Include at least six events, placed to scale. A useful scale: 1 cm = 250 million years puts the Big Bang 55.2 cm from today, the Sun’s birth 18.4 cm from today, the St. Francois Mountains about 5.9 cm from today and the Viburnum Trend ore about 1.1 cm from today.
Sources and honesty. Cite OpenStax Astronomy 2e, NASA, the USGS or the Missouri Geological Survey for any fact you did not measure. Where scientists disagree (the exact value of the Hubble constant; how much of each heavy element comes from mergers rather than rare supernovae), say so. You may choose a different heavy element (silver, which Missouri galena also carries, or gold, platinum or uranium) if you explain the same chain.
📖 Read for this lesson
The reading opens over the lesson; close it to come back to exactly where you were. The checks below draw on it.
Formative check
Work through these before moving on. They are not graded — they tell you whether the standard below has landed yet.
Which step in your lead biography could NOT have made lead nuclei?
Scientists fully agree on the exact value of the Hubble constant.
Write the claim-evidence-reasoning paragraph for chapter 2 of your biography (stars as factories). Include one calculation and one cited source.
How confident are you that you can communicate, with evidence and calculations, how the elements in a Missouri object were made?
Unit 1 checkpoint
Do this before you start the task. It covers the whole unit and tells you what to review first.
Why does the Sun lose mass as it shines?
The Sun converts about × 10⁹ kg of mass to energy every second.
An asteroid’s semi-major axis is 16 AU. What is its period?
A planet moves fastest when it is farthest from the Sun.
An ellipse with a = 20 cm and c = 5 cm has eccentricity .
A galaxy’s spectral line is shifted from 500.0 nm to 505.0 nm. What is its recession speed?
The cosmic microwave background is evidence for a hot, dense early universe.
Which elements did the Big Bang produce?
A star’s spectrum peaks at 400 nm. About what is its surface temperature?
Fusion inside a massive star releases energy all the way up to gold.
Sunlight takes about minutes to reach Earth.
Submit: The Cosmic Biography of Missouri Lead (1,000-1,300 words) + three-minute recorded presentation
Task: Write a scientific explanation, in four chapters, of how the lead atoms in a cube of Missouri galena came to exist, from the Big Bang to the Viburnum Trend. Include a to-scale timeline model with at least six events, at least two calculations from this unit (for example, the Sun’s mass loss, a redshift and recession velocity, or a Wien’s-law temperature), and at least three cited sources (OpenStax Astronomy 2e, NASA, the USGS, the Missouri Geological Survey, or your own lab data). Hand-drawn timelines are fully acceptable.
Submission workflow
- Stage 1 — Plan. Your four chapter claims, the evidence you will use for each, your two calculations worked out, and a sketch of the timeline with scale.
- Stage 2 — Self-reviewed draft. Check your draft with this checklist: underline the claim in each chapter, circle every number and write its source beside it, recompute both calculations from scratch on a fresh page, and mark one place where the evidence is vague. Submit the marked draft and a short revision plan.
- Stage 3 — Final explanation. 1,000-1,300 words with the timeline, calculations, sources cited, and a paragraph on what is still uncertain.
- Stage 4 — Presentation and defense. Three minutes, recorded as video or audio with your timeline shown, ending with a one-minute answer to one of these evidence questions: How do we know the universe was once hot and dense? Why can’t the Sun make lead? How do we know when the Viburnum Trend ore formed?
How it is scored
| Criterion | What proficient looks like |
|---|---|
| Origin of light elements and the universe (9-12.ESS1.A.2) | Uses at least two lines of Big Bang evidence with specific data and explains why they support the claim. |
| Stellar energy (9-12.ESS1.A.1) | Explains fusion as mass converted to energy, with a correct calculation, and describes the Sun’s life span. |
| Element production (9-12.ESS1.A.3) | Explains why fusion stops at iron and how slow neutron capture in giant stars and rapid neutron capture in supernovae and neutron-star mergers produce heavier elements such as lead, separating established from debated ideas. |
| Model (SEP.2, CCC.4) | Timeline is to scale, labeled, and shows matter cycling from stars to new systems. |
| Use of sources (RST.9-10.1, SEP.8) | Cites specific evidence from texts and data; sources named. |
| Communication (WHST.9-10.2) | Clear, organized explanation with precise vocabulary; the recorded presentation answers an evidence question accurately. |
Source File for the Cosmic Biography of Missouri Lead
Missouri Geological Survey fact sheets PUB0658 (Galena) and PUB0659 (Lead); Symons, Lewchuk and Leach 1998, Age and duration of the Mississippi Valley-type mineralizing fluid flow event in the Viburnum Trend (USGS Publications Warehouse record); USGS Fact Sheet 2018-3054, Divisions of Geologic Time; USGS Radiometric Time Scale; NIST Atomic Weights and Isotopic Compositions (lead); Domingo Pardo et al., PoS(NIC-IX)058; Travaglio et al. 2001 and Roederer et al. 2009 (arXiv abstracts); NASA Science, Sun: Facts and Overview: The Universe; Lawrence Berkeley National Laboratory; plus figures from the Unit 1 readings; all retrieved November 6, 2026 · SLS original (cites U.S. government works, Missouri Geological Survey fact sheets and published research; brief quotations only)
Why this reading. The task requires at least three cited sources, two calculations, a to-scale timeline of six events and a paragraph separating settled science from open questions. This file gathers the unit’s verified numbers into one evidence table with sources, adds the Missouri end of the story from the Missouri Geological Survey and the USGS, gives the nuclear-physics facts about where lead comes from, and works the timeline. All sources were retrieved November 6, 2026. Cite the sources named here, not this file.
Table 1. Evidence by chapter
| Chapter | Claim it supports | Specific evidence | Source |
|---|---|---|---|
| 1. The beginning | Galaxies recede faster the farther they are | Hubble’s 1929 table: the four Virgo nebulae at 2.0 Mpc recede at 500 to 1,090 km/s, while the nearest recede at under 300 km/s or approach; Hubble’s slope was about 500 km/s per Mpc (modern values 67.4 and 73.04) | Hubble, PNAS 15:168 (1929), as reproduced by NASA; Planck 2018; Riess et al. 2022 |
| 1 | The universe was once hot and dense | Microwave background at 2.72548 ± 0.00057 K with a thermal spectrum, the same in every direction | Fixsen 2009, ApJ 707:916 |
| 1 | The first minutes made hydrogen and helium, not lead | About 25% of ordinary matter by mass is helium made before any star existed | Lawrence Berkeley National Laboratory, Origin of the Light Elements |
| 1 | Time since the beginning | 1/H0 = 14.0 billion years at 70 km/s per Mpc (13.4 to 14.5 for the two measured values); full models give about 13.8 billion | Lesson 1.3 reading |
| 2. Stars as factories | Fusion converts mass to energy | Luminosity 3.828 × 1026 W; 4 H (4.03130 u) to He-4 (4.00260 u) loses 0.71%; mass loss 4.26 × 10⁹ kg/s | NASA Sun Fact Sheet; NIST atomic masses |
| 2 | Stars have finite lives | The solar system formed about 4.6 billion years ago | NASA Science, Sun: Facts |
| 3. The heavy-element events | Slow neutron capture ends at lead and bismuth | “Bismuth is the last isotope produced by the s process because further neutron capture on Bi leads to the Po-isotopes, which are α-unstable”; the s-process operates in thermally pulsing low-mass AGB stars | Domingo Pardo et al., n_TOF Collaboration, PoS(NIC-IX)058 |
| 3 | Giant stars are the main source of lead | Model of the Galaxy’s chemical history: low-mass AGB stars are the main producers of lead, and they reproduce the solar system’s lead isotopes, including the more than 50% of solar lead-208 once credited to a separate “strong component” | Travaglio et al. 2001, accepted for ApJ (arXiv:astro-ph/0011050) |
| 3 | Rapid neutron capture builds the heaviest nuclei | Old, metal-poor stars whose heavy elements came only from the r-process contain lead, thorium and uranium; the r-process reproduces the solar pattern of heavy elements from barium to uranium | Roederer et al. 2009, ApJ 698:1963 (arXiv:0904.3105) |
| 3 | Neutron-star mergers make heavy elements | GW170817, August 17, 2017, in NGC 4993 about 130 million light-years away; the kilonova was followed by many telescopes | NASA release on GW170817 (Lesson 1.4 reading) |
| 3 | Some lead is made by radioactive decay | Uranium-238 → lead-206 (half-life 4.5 billion years); uranium-235 → lead-207 (704 million years); thorium-232 → lead-208 (14.0 billion years) | USGS, Radiometric Time Scale |
| 4. Arrival in Missouri | Missouri’s basement rocks are old but much younger than the lead nuclei | St. Francois Mountains volcanic and plutonic rocks, 1.48 to 1.45 billion years old | USGS Professional Paper 1866 (summarized in RLP Physics B’s crust reading) |
| 4 | The ore sits in Cambrian sea-floor rock | The Viburnum Trend is a Mississippi Valley-type lead-zinc deposit in the Upper Cambrian Bonneterre Dolomite; the Late Cambrian spans about 497 to 485.4 million years ago | Symons, Lewchuk and Leach 1998 (USGS Publications Warehouse); USGS Fact Sheet 2018-3054, Divisions of Geologic Time |
| 4 | The galena formed long after its host rock | Paleomagnetism of 233 specimens of galena ore from four mines along the roughly 70 km Trend: Early Permian mean age 273 ± 10 million years; mineralizing event lasted at most 12 million years; consistent with fluid flow from the Ouachita mountain belt to the south | Symons, Lewchuk and Leach 1998 |
| 4 | Missouri’s lead and its history | Lead ore found near Mine La Motte (Madison County) in 1720; Missouri the top U.S. producer since 1907 (except 1962); all production now from the 35-mile Viburnum Trend; galena is 86.6% lead by mass when pure; official state mineral since 1967 | Missouri Geological Survey, PUB0658 (Galena) |
| 4 | Scale and uses | All-time Missouri lead production more than 30 million tons; galena can carry silver in its crystal structure; lead-acid batteries account for 85% of U.S. lead use | Missouri Geological Survey, PUB0659 (Lead) |
Lead’s four stable isotopes (NIST)
| Isotope | Share of natural lead | Where it comes from |
|---|---|---|
| Lead-204 | 1.4% | Only neutron capture in stars; no common radioactive parent |
| Lead-206 | 24.1% | Neutron capture, plus decay of uranium-238 |
| Lead-207 | 22.1% | Neutron capture, plus decay of uranium-235 |
| Lead-208 | 52.4% | Neutron capture, plus decay of thorium-232 |
NIST lists these as representative values and flags lead’s composition as variable in nature: rocks rich in uranium and thorium build up extra lead-206, -207 and -208 over time, which is exactly why lead isotopes can date rocks (Unit 2). Check: 1.4 + 24.1 + 22.1 + 52.4 = 100.0%. NIST’s standard atomic weight of lead is 207.2.
A calculation you can use. Galena is PbS. With lead 207.2 and sulfur 32.06, PbS is 239.26 g/mol, and lead is 207.2 ÷ 239.26 = 86.6% of it, the Missouri Geological Survey’s figure. A 100 g galena cube therefore holds 86.6 g of lead, or 86.6 ÷ 207.2 = 0.418 mol, about 0.418 × 6.022 × 1023 = 2.52 × 10²³ lead atoms. Every one of those nuclei was built by neutron capture in a star or a stellar explosion, or decayed from uranium or thorium that was.
Not all of it is older than the Sun. Uranium-238 has a half-life of 4.5 billion years, about the age of the solar system, so roughly half of the uranium-238 Earth started with has already become lead-206 since the Sun formed: (1/2)4.54/4.5 = 0.497 is still left. Those lead-206 nuclei are younger than the Sun, but the 206 protons and neutrons in each one were assembled into a heavy nucleus by the r-process before the Sun existed. A careful biography says so.
The timeline, worked at the lesson’s scale
The lesson suggests 1 cm = 250 million years. Divide each age in millions of years by 250 to get centimeters from today.
| Event | Age (millions of years) | Distance from today (cm) | Source for the age |
|---|---|---|---|
| Big Bang | 13,800 | 55.2 | NASA Science, Overview: The Universe |
| Sun and solar system form | about 4,600 | 18.4 | NASA Science, Sun: Facts |
| St. Francois Mountains volcanoes and granites | 1,480 to 1,450 | 5.92 to 5.80 | USGS Professional Paper 1866 |
| Bonneterre dolomite laid down in a Late Cambrian sea | about 497 to 485 | 1.99 to 1.94 | USGS (Upper Cambrian host); USGS Fact Sheet 2018-3054 |
| Galena deposited in the Viburnum Trend | 273 ± 10 | 1.09 (1.05 to 1.13) | Symons, Lewchuk and Leach 1998 |
| Lead ore found near Mine La Motte | 0.000306 (1720) | 0.0000012, that is, today | Missouri Geological Survey, PUB0658 |
The heavy-element events that built the lead nuclei happened somewhere in the 9 billion years between the Big Bang and the Sun, so they belong between 55.2 cm and 18.4 cm; mark them as a shaded band, not a point, because no one knows which particular stars made Missouri’s lead. The galena crystals themselves are young by comparison: the ore is about 1 cm from today on a 55 cm line.
Two calculations, checked
- The Sun’s mass loss. 3.828 × 1026 W ÷ (2.998 × 10⁸ m/s)2 = 4.26 × 10⁹ kg/s. Hydrogen consumed: 4.26 × 10⁹ / 0.0071 = 6.0 × 10¹¹ kg/s. (Lesson 1.1 reading.)
- A redshift and distance. z = (671.0 − 656.3)/656.3 = 0.0224; v = 0.0224 × 299,792 = 6,715 km/s; d = 6,715/70 = 96 Mpc. (Lesson 1.3 reading.)
- A Wien temperature. A star peaking at 290 nm has T = 2.898 × 10⁻³ / 2.90 × 10−7 = 9,993 K, about 10,000 K. (Lesson 1.4 practice.)
Settled and unsettled
Settled, in the sense that many independent measurements agree: expansion and its rough age, the microwave background, primordial helium, fusion as the Sun’s power source, the making of elements up to iron in stars, and the fact that the s-process ends at lead and bismuth. Genuinely open: the exact value of H0 (67.4 ± 0.5 against 73.04 ± 1.04, a disagreement whose cause is unknown); what share of the r-process elements comes from neutron-star mergers against rare supernovae; and, closer to home, exactly when and how the ore fluids moved (the 273 ± 10 million-year age comes from one method, paleomagnetism, and carries a 20 million-year range). A paragraph on uncertainty that names these, with their numbers, meets the rubric; one that says “scientists are still learning” does not.
Citing
Use the form: source, what it says, where. For example: “The Missouri Geological Survey’s galena fact sheet (PUB0658) says all of Missouri’s lead production now comes from the Viburnum Trend, a 35-mile-long district.” Your own lab data count as a source when you name the lab and the date.
Sources: Missouri Geological Survey, Galena: Missouri’s Official State Mineral (PUB0658) (dnr.mo.gov); Missouri Geological Survey, Lead (PUB0659) (dnr.mo.gov); Symons, Lewchuk and Leach 1998, Age and duration of the Mississippi Valley-type mineralizing fluid flow event in the Viburnum Trend, southeast Missouri (USGS) (usgs.gov); USGS Fact Sheet 2018-3054, Divisions of Geologic Time (pubs.usgs.gov); USGS, Radiometric Time Scale (pubs.usgs.gov); NIST, Atomic Weights and Isotopic Compositions: lead (physics.nist.gov); Domingo Pardo et al., Neutron capture measurements on the s-process termination isotopes lead and bismuth, PoS(NIC-IX)058 (pos.sissa.it); Travaglio et al. 2001, Lead: Asymptotic Giant Branch production and Galactic Chemical Evolution (arXiv:astro-ph/0011050) (arxiv.org); Roederer et al. 2009, The End of Nucleosynthesis: Production of Lead and Thorium in the Early Galaxy (arXiv:0904.3105) (arxiv.org); NASA Science, Sun: Facts (science.nasa.gov); NASA Science, Overview: The Universe (science.nasa.gov); Lawrence Berkeley National Laboratory, Origin of the Light Elements (aether.lbl.gov); Hubble 1929, PNAS 15:168, as reproduced by NASA (APOD) (apod.nasa.gov); Planck Collaboration, Planck 2018 results VI (arXiv:1807.06209) (arxiv.org); Riess et al. 2022 (arXiv:2112.04510) (arxiv.org); Fixsen 2009, The Temperature of the Cosmic Microwave Background (arXiv:0911.1955) (arxiv.org); NASA Sun Fact Sheet (NSSDC) (nssdc.gsfc.nasa.gov)
The Sun by the Numbers: NASA’s Fact Sheet and the Arithmetic of Fusion
NASA Sun Fact Sheet (NSSDC, last updated 9 May 2024) and Earth Fact Sheet (15 November 2024); NIST Atomic Weights and Isotopic Compositions; CODATA 2022 constants; retrieved September 23, 2026 · Public domain (works of the United States government), with SLS original worked computations
Why this reading. The lesson asks you to predict how long a coal Sun would burn, to explain where 0.7% of the mass goes, and to fill in 4.3 million tons per second and 8.3 minutes. Every one of those numbers can be computed from a handful of measured quantities, and the measured quantities are below, as NASA and NIST publish them. Do the arithmetic yourself; if your answer differs from the lesson’s, you will be able to say at which step.
Table 1. The Sun, as NASA publishes it
NASA Sun Fact Sheet, National Space Science Data Center, retrieved September 23, 2026. The page gives no age; NASA’s Sun overview page states the Sun formed about 4.6 billion years ago.
| Quantity | Value as printed | In everyday units |
|---|---|---|
| Mass | 1,988,400 × 1024 kg | 1.988 × 1030 kg (about 333,000 Earths) |
| Luminosity | 382.8 × 1024 J/s | 3.828 × 1026 W |
| Volumetric mean radius | 695,700 km | 109 Earth radii |
| Mean density | 1,408 kg/m3 | 1.41 g/cm3, a little denser than water |
| Effective (surface) temperature | 5,772 K | about 5,500 °C |
| Central temperature | 1.571 × 10⁷ K | 15.7 million K |
| Central density | 1.622 × 10⁵ kg/m3 | 162 g/cm3, eight times denser than gold |
| Mass loss rate (as printed) | 4,260 × 106 kg/s | 4.26 × 10⁹ kg every second |
From the Earth Fact Sheet: semimajor axis of Earth’s orbit 149.598 × 10⁶ km; solar irradiance 1,361.0 W/m2. From NIST: the mass of a hydrogen-1 atom is 1.00782503223 u and of a helium-4 atom 4.00260325413 u. From CODATA 2022: the speed of light c = 299,792,458 m/s exactly.
Check 1: the solar constant follows from the luminosity
Spread 3.828 × 1026 W over a sphere of radius 1.49598 × 10¹¹ m. The sphere’s area is 4πd2 = 4 × 3.1416 × (1.49598 × 1011)2 = 2.812 × 10²³ m2. Then 3.828 × 1026 / 2.812 × 1023 = 1,361 W/m2, exactly NASA’s irradiance. Two independently measured numbers agree, which is what you want from a model.
Check 2: the missing mass
Four hydrogen atoms: 4 × 1.00782503 = 4.03130013 u. One helium-4 atom: 4.00260325 u. Difference: 0.02869687 u. As a fraction of the starting mass, 0.02869687 / 4.03130013 = 0.00712, that is 0.71%. (Using atomic rather than nuclear masses cancels the electrons on both sides, so the fraction is the same either way.)
Check 3: mass lost per second, and the fill-in-the-blank
E = mc2, so m = E/c2. Per second: 3.828 × 1026 J / (2.99792 × 10⁸ m/s)2 = 3.828 × 1026 / 8.98755 × 1016 = 4.259 × 10⁹ kg/s. NASA’s own line, 4,260 × 106 kg/s, is the same number. One metric ton is 1,000 kg, so this is 4.26 million metric tons per second, the lesson’s 4.3 million. Because only 0.712% of the fused hydrogen disappears, the hydrogen consumed per second is 4.259 × 10⁹ / 0.00712 = 5.98 × 10¹¹ kg/s, about 600 million tons of hydrogen a second.
Check 4: how long light takes
Distance over speed: 1.49598 × 10¹¹ m / 2.99792 × 10⁸ m/s = 499.0 s = 8.32 minutes. That is the second blank. (Light from the surface takes 8.3 minutes; the energy it carries took far longer to work its way out of the interior, so the two times measure different things.)
Check 5: the coal Sun
Burning coal in oxygen releases roughly 30 million joules per kilogram (an ordinary engineering figure for good coal; take it as an upper bound). If the whole solar mass were coal: 1.988 × 1030 kg × 3 × 107 J/kg = 6 × 1037 J. At 3.828 × 1026 W that lasts 6 × 1037 / 3.828 × 1026 = 1.6 × 10¹¹ s. One year is 3.156 × 10⁷ s, so about 5,000 years. The Sun is 4.6 billion years old. Chemistry is short by a factor of about a million; only nuclear reactions, releasing about 0.7% of the fuel’s mass as energy, close the gap.
Check 6: how long the hydrogen lasts
Only the core, roughly a tenth of the Sun’s mass, ever gets hot enough to fuse. A tenth of 1.988 × 1030 kg is 1.99 × 1029 kg. At 5.98 × 10¹¹ kg/s that is 3.3 × 10¹⁷ s, or 3.3 × 10¹⁷ / 3.156 × 107 = 1.05 × 10¹⁰ years: about 10 billion years of hydrogen fusion, which is why the lesson calls the Sun roughly halfway through its life. The one-tenth figure is the rough part of this estimate, and a careful answer says so.
What the numbers are evidence of
Notice which claims rest on measurement and which on inference. The luminosity, distance, irradiance and atomic masses are measured. The mass-loss rate is computed from them with E = mc2. The core temperature of 15.7 million K comes from models of a gas ball that must hold itself up against its own gravity while radiating 3.8 × 1026 W; it cannot be measured with a thermometer. When you write an investigable question for the board, ask about the inferred quantities: What observation would tell us the core is really that hot? (One answer, which you may look into later, is the neutrinos that fusion produces and that detectors on Earth count.)
Your turn
- Redo Check 3 using 3.83 × 1026 W and 3.00 × 10⁸ m/s, the rounded values in the mini-lecture. How much does the answer change, and does it still round to 4.3 million tons?
- NASA lists the central density as 162 g/cm3 and the mean density as 1.41 g/cm3. What does that contrast tell you about where the Sun’s mass is concentrated, and why does it matter for where fusion happens?
- Rewrite the coal estimate for a fuel ten times better than coal. Does anything change about the conclusion?
Sources: NASA Sun Fact Sheet (NSSDC) (nssdc.gsfc.nasa.gov); NASA Earth Fact Sheet (NSSDC) (nssdc.gsfc.nasa.gov); NASA Science: Sun facts (science.nasa.gov); NIST Atomic Weights and Isotopic Compositions (H, He) (physics.nist.gov); NIST CODATA 2022 fundamental constants (physics.nist.gov)
NIST’s Line Lists for Hydrogen, Helium and Mercury, Wien’s Law Checked, and the 2017 Kilonova
NIST Atomic Spectra Database, Lines query for H I, He I and Hg I, 380-750 nm, observed wavelengths and relative intensities, retrieved September 23, 2026; CODATA 2022 Wien constant; NASA news release of October 16, 2017 on GW170817 · Public domain (works of the United States government), with SLS original worked computations
Why this reading. Option C of the spectroscope lab needs the NIST line lists; here they are, so the option works with no internet. The blackbody task needs Wien’s law checked against real temperatures; the checks are worked below. And the gold story needs the evidence for GW170817 as NASA reported it. The line tables are the data; the intensities are NIST’s relative values on an arbitrary scale, useful only for comparing lines of the same element.
Table 1. Hydrogen (H I), visible lines from NIST
Observed wavelengths in air, nanometers, with NIST relative intensity. The four brightest are the Balmer lines a hydrogen lamp shows.
| Wavelength (nm) | Relative intensity | Color | Name |
|---|---|---|---|
| 656.279 | 500,000 | red | H-alpha |
| 486.135 | 180,000 | blue-green | H-beta |
| 434.047 | 90,000 | violet-blue | H-gamma |
| 410.173 | 70,000 | violet | H-delta |
| 397.008 | 30,000 | violet (edge of vision) | H-epsilon |
| 388.906 | 70,000 | near-ultraviolet | H-zeta |
Table 2. Helium (He I), strongest visible lines from NIST
| Wavelength (nm) | Relative intensity | Color |
|---|---|---|
| 587.562 | 500 | yellow (the line found in the Sun in 1868) |
| 706.519 | 200 | deep red |
| 447.148 | 200 | blue |
| 501.568 | 100 | green |
| 667.815 | 100 | red |
| 388.865 | 500 | near-ultraviolet, not visible |
Table 3. Mercury (Hg I), strongest visible lines from NIST
The gas inside every fluorescent tube and compact fluorescent lamp.
| Wavelength (nm) | Relative intensity | Color |
|---|---|---|
| 404.657 | 12,000 | violet |
| 435.834 | 12,000 | blue |
| 546.075 | 6,000 | green |
| 576.961 | 1,000 | yellow |
| 579.067 | 900 | yellow (the close pair with 576.961) |
| 407.784 | 1,000 | violet |
| 690.746 | 1,000 | red (faint in most lamps) |
| 567.581 | 600 | yellow-green |
Compare Table 3 with Option B’s Source 3: sharp lines at about 405, 436 and 546 nm with a close yellow pair near 577 and 579. That is mercury, line for line. A fluorescent lamp also shows a faint continuous background and extra lines from the phosphor coating, which is why a real sketch is never as clean as the database. Hydrogen and helium are not in household lamps; astronomers see their lines in stars, and Table 1 is why the Sun’s spectrum shows a dark line at 656.3 nm and why a galaxy’s redshift is measured against it (Lesson 1.3).
Wien’s law against real temperatures
The CODATA 2022 value of the Wien displacement constant is b = 2.897771955 × 10⁻³ m·K (exact). Peak wavelength = b/T.
| Object and temperature | Computation | Peak wavelength | Band |
|---|---|---|---|
| Sun, 5,772 K (NASA effective temperature) | 2.8978 × 10⁻³ / 5,772 | 502.0 nm | visible, blue-green |
| The sim’s Sun preset, 5,800 K | 2.8978 × 10⁻³ / 5,800 | 499.6 nm | visible, blue-green |
| Red dwarf, 3,000 K | / 3,000 | 965.9 nm | infrared |
| Hot star, 10,000 K | / 10,000 | 289.8 nm | ultraviolet |
| Blue star, 25,000 K | / 25,000 | 115.9 nm | far ultraviolet |
These reproduce the mini-lecture’s 502, 966 and 116 nm. The no-sim route asks you to place the 5,800 K, 3,000 K and 10,000 K peaks on a wavelength scale: 500 nm sits in the green, 966 nm is beyond red (above 750 nm), 290 nm is below violet (under 380 nm). A star whose peak is in the infrared still emits some visible light, mostly at the red end, which is why Betelgeuse and Antares look orange-red; a star peaking in the ultraviolet spills into the violet and blue, which is why Rigel and Vega look blue-white.
GW170817 and the kilonova, as NASA reported it
NASA news release, October 16, 2017. On August 17, 2017, the LIGO and Virgo detectors recorded gravitational waves from two neutron stars merging, event GW170817. NASA’s Fermi telescope detected a gamma-ray burst from the same direction at 8:41 a.m. EDT, nearly simultaneously. The source was in the galaxy NGC 4993, about 130 million light-years away in the constellation Hydra. Swift, Hubble, Chandra and Spitzer then followed the fading glow, the kilonova; Chandra detected X-rays nine days later. NASA wrote that merging neutron stars “may be the universe’s dominant source for many of the heaviest elements, including platinum and gold”, and that Spitzer’s infrared data were expected to help measure how much gold was forged. The release gives no mass of gold. That is the honest state of the evidence for a grade 9 explanation: a merger was seen, its glow matched the predicted decay of freshly made heavy elements, and the exact share of the universe’s gold that comes from mergers is still being measured.
Reading the evidence
Three kinds of evidence appear on this page. The line lists are laboratory measurements: an element’s electrons emit only certain energies, so a set of lines identifies the element wherever it is. Wien’s law is a checked relation: the same formula fits the Sun and a lamp. The kilonova is one observed event interpreted through a model. When your flow model of element production draws an arrow from “neutron-star merger” to “gold”, label that arrow with GW170817 and the date, and mark it as current research.
Sources: NIST Atomic Spectra Database, Lines query form (physics.nist.gov); NIST CODATA 2022 Wien wavelength displacement law constant (physics.nist.gov); NASA, ‘NASA Missions Catch First Light from a Gravitational-Wave Event’, October 16, 2017 (nasa.gov); NASA Sun Fact Sheet (effective temperature) (nssdc.gsfc.nasa.gov)