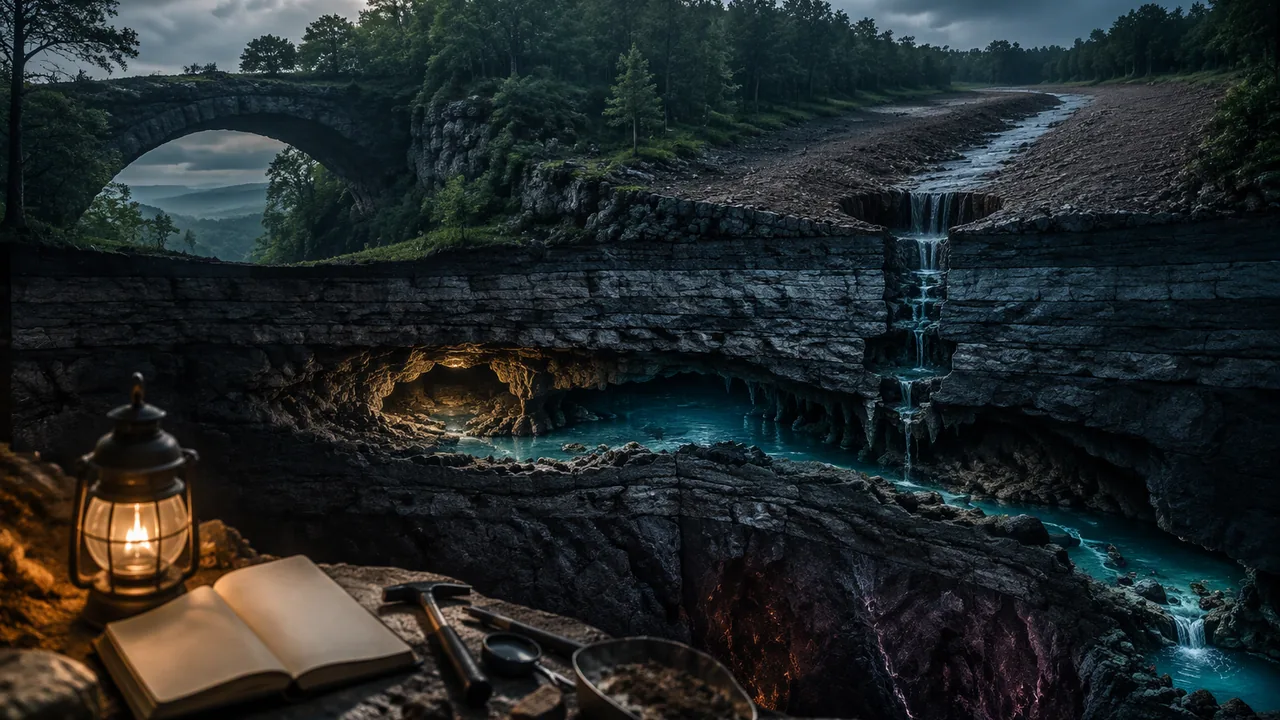
explain, with data from my own investigations and at least two calculations, how internal and surface processes shaped a Missouri landscape and how it is changing now.
Instruction
The question. How did one Missouri landscape come to look the way it does, and how is it changing now? Choose Big Spring and the Current River valley, Elephant Rocks, Johnson’s Shut-Ins and Proffit Mountain, the sinkholes, caves and natural bridge of Ha Ha Tonka State Park, or another Missouri landscape you can document with public sources from the U.S. Geological Survey, the National Park Service, the Missouri Geological Survey or Missouri State Parks. Your explanation uses the rocks (Lesson 4.1), running water (4.2), slope stability and feedbacks (4.3), and the properties of water (4.4), and it connects them to Unit 3’s story of how Missouri’s crust was built in the middle of a plate.
What to include.
- The rocks. What rock is the landscape made of, how did it form, and how did it reach the surface? Use the rock cycle.
- The builders. Which internal processes made or raised it (the volcanoes and granite of the St. Francois Mountains about 1.5 billion years ago, the slow, broad uplift of the Ozark Plateau, the shallow seas that laid down the dolomite)?
- The sculptors. Which surface processes are wearing it down (frost wedging, chemical weathering and dissolution, rivers, floods, slope failure, sinkhole collapse)? Use data from at least two of your labs as evidence.
- A feedback. Identify one change to the surface that causes changes in another system, such as land clearing releasing gravel into streams, a dam trapping sediment so the river below changes, or storm water piped into sinkholes making them grow faster.
- Scales. Show processes at three time scales: a single storm, thousands of years, and millions of years.
Two calculations. For example: a discharge and sediment load (Q = 20 × 1.5 × 1.2 = 36 m3/s; at 500 mg/L that is 18 kg/s); a factor of safety (FS = μ cos θ / sin θ; for μ = 0.7 on a 30° slope, 0.7 × 0.866 / 0.5 ≈ 1.21, dropping to about 0.73 if pore water removes 40% of the pressing force); an ice-expansion volume (1.09 times the water volume); a dissolved-rock load (concentration × discharge); or a surface-area ratio.
A worked paragraph (Big Spring and the Current River). Claim: “Water dissolving rock underground, as much as water cutting at the surface, has shaped the Current River landscape.” Evidence: “Big Spring’s water carries a typical 173 mg/L of dissolved rock, measured as calcium carbonate, and its mean flow in water year 2026 was 363 ft³/s, or 10.3 m³/s; 10.3 × 1,000 L/m³ × 0.173 g/L ≈ 1,780 g/s, about 154 metric tons of rock a day. The Current River’s highest day that year was only 12.5 times its lowest, the steady flow of a spring-fed river, and Missouri has more than 16,000 known sinkholes. In our chalk lab, acid and surface area together dissolved most of the chalk.” Reasoning: “Slightly acidic groundwater dissolves the dolomite along cracks, enlarging them into conduits and caves; the rock leaves in solution through the springs, the ground above collapses into sinkholes, and the springs keep the river flowing between storms.”
Care with people. If you write about floods, sinkhole collapses or dam failures that hurt people or homes, state the human impact accurately and respectfully before the analysis.
Limits. Say what you cannot know from your evidence: for example, how well a tray of sand stands for a real river, how well chalk in vinegar stands for dolomite in groundwater, or how the ages of rocks are measured.
📖 Read for this lesson
The reading opens over the lesson; close it to come back to exactly where you were. The checks below draw on it.
Formative check
Work through these before moving on. They are not graded — they tell you whether the standard below has landed yet.
A slope has μ = 0.7 and an angle of 30°. What is its factor of safety when dry?
Dams on the upper Missouri River reduced the amount of sediment the river carries downstream toward St. Louis and the Mississippi.
Write the ‘sculptors’ paragraph for your landscape in claim-evidence-reasoning form, using data from one of your labs and one calculation.
How confident are you that you can explain how internal and surface processes shaped a Missouri landscape, using my own data?
Unit 4 checkpoint
Do this before you start the task. It covers the whole unit and tells you what to review first.
A 40.0 g sample displaces 15.0 cm³ of water. What is its density?
Which rock forms when heat and pressure change limestone without melting it?
In the rock cycle, surface processes are driven mainly by the Sun’s energy and gravity.
A stream 10 m wide and 2 m deep flowing at 1.5 m/s has a discharge of m³/s.
Where does a stream drop its largest grains?
Water expands by about % when it freezes.
A slope has FS = 1.3 when dry. Pore water reduces the pressing force by 30%. What is the new FS?
Clearing Ozark forests and letting livestock crowd into valley bottoms helped release gravel that is still moving through Ozark streams.
Which change would speed chemical weathering of a limestone block the most?
Water’s specific heat is about five times that of granite.
Submit: Reading a Missouri Landscape (1,000-1,300 words) + three-minute presentation
Task: Write a scientific explanation of how one Missouri landscape formed and how it is changing. Include (1) the rock type and its origin through the rock cycle; (2) the internal processes that made or raised it; (3) the surface processes wearing it down, with data from at least two of this unit’s labs; (4) at least two calculations; (5) one feedback between Earth’s systems; (6) a labeled model or annotated photograph showing processes at three time scales; (7) a limits paragraph. Cite Earle’s Physical Geology and any U.S. Geological Survey, National Park Service, Missouri Geological Survey or Missouri State Parks source you use. Hand-drawn models are fully acceptable.
Submission workflow
- Stage 1 — Plan. Your landscape, your central claim, an evidence table (lab data, sources, calculations), and a sketch of your model with its three time scales.
- Stage 2 — Self-checked draft. Recompute every calculation from scratch, check that your lab data are used as evidence and not just described, and mark any process you named without a mechanism. You may also read the draft aloud to a family member and note where they got lost. Submit the marked-up draft and your revision plan.
- Stage 3 — Final explanation. 1,000-1,300 words with the model, lab data, calculations, sources and a limits paragraph.
- Stage 4 — Presentation. Three minutes, recorded or live, followed by one question about your evidence.
How it is scored
| Criterion | What proficient looks like |
|---|---|
| Water and surface processes (9-12.ESS2.C.1) | Explains how the properties of water drive the weathering, erosion and deposition in the landscape, using data from at least two labs. |
| Internal and surface processes across scales (9-12.ESS2.A.1, CCC.7) | Model shows processes at three time scales and how uplift and erosion together shaped the landscape. |
| Feedbacks (9-12.ESS2.A.2) | Identifies one feedback, with each link in the chain explained and supported by evidence. |
| Quantitative reasoning (SEP.4) | Two calculations correct, with units and assumptions stated. |
| Explanation (SEP.6, WHST.9-10.2) | Clear, well-organized mechanism for each claim; limits stated honestly. |
| Use of sources (RST.9-10.1) | Specific evidence cited from Earle, USGS, NPS or Missouri agency sources and from your own lab data. |
Missouri Minerals, the Eight Cards Worked, Elephant Rocks and the Karst Record
webmineral.com data pages for quartz, orthoclase, calcite, dolomite, pyrite, magnetite and galena; Robertson 1988, USGS Open-File Report 88-441, Table 11; Missouri Geological Survey karst, caves, sinkholes, springs, losing streams and state geologic symbols pages; Missouri State Parks, Elephant Rocks natural history; NPS Ozark National Scenic Riverways, Big Spring and springs pages; USGS SIR 2009-5111; retrieved November 6, 2026 · SLS original (cites USGS, NPS, Missouri Geological Survey and Missouri State Parks public records and published mineral data; brief quotations only)
Why this reading. The lab’s reference densities need a source, its Option B cards have blank density and identification columns, and the phenomenon paragraph states sizes, ages and counts that need a citation. Here are the mineral and rock densities as two public references give them, the eight cards fully worked, and the Missouri records behind Elephant Rocks, Big Spring and the state’s karst, all retrieved November 6, 2026.
Table 1. Reference properties of minerals (webmineral.com mineral data pages)
| Mineral | Formula | Density (g/cm3) | Hardness | Streak and other tests |
|---|---|---|---|---|
| Quartz | SiO2 | 2.6-2.65 | 7 | White; glassy |
| Orthoclase (a feldspar) | KAlSi3O8 | 2.56 | 6 | White |
| Calcite | CaCO3 | 2.71 | 3 | White; fizzes in acid |
| Dolomite | CaMg(CO3)2 | 2.8-2.9 (average 2.84) | 3.5-4 | White |
| Pyrite | FeS2 | 5-5.02 | 6.5 | Greenish black; metallic |
| Magnetite | Fe3O4 | 5.1-5.2 (average 5.15) | 5.5-6 | Black; naturally strongly magnetic |
| Galena | PbS | 7.2-7.6 (average 7.4) | 2.5 | Grayish black; metallic, lead gray; perfect cubic cleavage; 86.6% lead by mass |
Rocks are mixtures, so their densities vary. The U.S. Geological Survey’s compilation of rock properties (Robertson 1988, Table 11) lists average bulk densities of granite 2.67 g/cm3, and gabbro 2.98 and diabase 2.97, the coarse- and medium-grained equivalents of basalt, which is why the lesson uses “basalt about 3.0.” Sedimentary rocks depend on how much open space they hold: sandstone is 2.7 with almost no pores but 2.3 at 20% porosity, and dolomite 2.8 at 3%.
The Missouri Geological Survey lists galena as Missouri’s state mineral, “the primary ore of lead.” Galena against quartz: 7.4 / 2.65 = 2.79, the lesson’s “about 2.8 times as dense.”
Table 2. The eight Option B cards, worked
Density = mass / volume. Identification uses the density and the card’s other tests together; a density alone can be shared by two minerals.
| Card | Mass (g) | Volume (cm3) | Density (g/cm3) | Deciding tests | Identification |
|---|---|---|---|---|---|
| 1 | 34.6 | 13.1 | 2.64 | Glassy, scratches glass, no fizz | Quartz |
| 2 | 30.8 | 12.0 | 2.57 | Pearly, salmon pink, just scratches glass | Orthoclase feldspar |
| 3 | 27.3 | 10.1 | 2.70 | Scratched by a nail, fizzes strongly | Calcite |
| 4 | 90.3 | 12.2 | 7.40 | Lead gray, gray-black streak, breaks into cubes, soft | Galena |
| 5 | 57.8 | 11.1 | 5.21 | Black streak, attracts a magnet | Magnetite |
| 6 | 81.2 | 30.1 | 2.70 | Large interlocking crystals, no layers | Granite: igneous, cooled slowly underground |
| 7 | 90.4 | 30.2 | 2.99 | Crystals too small to see, gas bubbles | Basalt: igneous, cooled fast at the surface |
| 8 | 63.9 | 27.0 | 2.37 | Cemented sand grains in layers, weak fizz on the cement | Sandstone: sedimentary (a carbonate cement) |
Card 1 against the quartz reference: (2.64 − 2.65) / 2.65 = −0.0033, a percent difference of −0.3%. Density does the most work for the metallic cards: galena (7.40) and magnetite (5.21) are both dark and metallic, but they differ by more than 2 g/cm3, and the magnet and the cubic cleavage confirm it. Cards 1, 2 and 3 all fall between 2.57 and 2.70 and are told apart by hardness and the fizz instead. Card 8’s low density is the air between cemented grains: sedimentary rocks are porous. Sources of error to name: an air bubble clinging to a sample adds to its apparent volume and lowers the density; two cylinder readings each off by up to half a milliliter can add up to 1 mL, a 10% error on a 10 mL sample but only 3% on a 30 mL sample, so the small mineral grains carry the largest relative error; a wet sample weighs more than a dry one.
Elephant Rocks (Missouri State Parks)
The park’s natural-history page: the granite formed about 1.5 billion years ago when magma “accumulated deep below the earth’s surface” and slowly cooled into red granite. As erosion removed the weight of the rock above, horizontal and vertical cracks broke the granite into huge angular blocks; water moving down the fractures disintegrated the granite next to them and rounded the corners “while still underground,” forming core stones that erosion later exposed. Today rainwater that freezes in small fractures keeps rounding the boulders, lichens add a weak acid, and rain-filled “solution pans” up to several feet across pit the top of the outcrop. The landform is a tor, “Missouri’s finest.” The largest boulder, Dumbo, is 27 feet tall, 34 feet long, 17 feet wide and weighs 680 tons.
Checking Dumbo’s weight. An ellipsoid fills π/6 of the box around it. Box: 10.36 m × 5.18 m × 8.23 m = 441.9 m3; ellipsoid: 231.4 m3; at granite’s 2.67 t/m3, 618 metric tons = 681 short tons, within 1% of the published 680. The density from Table 1’s source and the park’s measurements agree.
Missouri’s karst (Missouri Geological Survey; National Park Service)
| Feature | As published |
|---|---|
| Caves | “approximately 7,500 recorded caves”; Missouri “has become known as the Cave State” |
| Sinkholes | about 16,000 identified, “although, many more exist”; the largest known covers about 700 acres in western Boone County; some are more than 100 feet deep |
| Springs | more than 4,400; water entering a sinkhole can travel more than 30 miles underground before reaching a spring |
| Losing streams | streams that lose at least 30% of their water underground during dry conditions |
| How sinkholes form | water moving through cracks “slowly dissolves the rock and carries it away in solution”; soil washes into the voids, and when it “can no longer support itself, it collapses” |
| Big Spring (NPS) | average flow about 289 million gallons a day; dye traces show water traveling up to 45 miles underground, taking 7 to 14 days; over 800 million gallons a day at peak flow |
Sudden change: the Taum Sauk breach (USGS)
On December 14, 2005, a 680-foot-wide section of the Taum Sauk upper reservoir embankment failed, and about 1.5 billion gallons of water ran down Proffit Mountain into Johnson’s Shut-Ins State Park, depositing “enormous quantities of rock, soil, and vegetation” (USGS, Barr 2009). Lesson 4.3 uses this event in detail.
Scale, checked
The lesson’s illustrative exhumation: granite formed about 8 km down and exposed over 90 million years gives 8,000,000 mm / 90,000,000 years = 0.089 mm per year, about the thickness of a sheet of paper each year. The Taum Sauk water emptied a 1.5-billion-gallon reservoir in minutes. Both are surface processes driven by gravity; the contrast between them is the subject of your question log.
Sources: webmineral.com, Galena mineral data (webmineral.com); webmineral.com, Dolomite mineral data (webmineral.com); webmineral.com, Quartz, Orthoclase, Calcite, Pyrite and Magnetite data pages (webmineral.com); Robertson, E.C., 1988, Thermal Properties of Rocks, USGS Open-File Report 88-441 (pubs.usgs.gov); Missouri Geological Survey, Karst in Missouri (dnr.mo.gov); Missouri Geological Survey, Caves (dnr.mo.gov); Missouri Geological Survey, Sinkholes (dnr.mo.gov); Missouri Geological Survey, Springs (dnr.mo.gov); Missouri Geological Survey, State Geologic Symbols (dnr.mo.gov); Missouri State Parks, Natural History – Elephant Rocks (mostateparks.com); NPS Ozark National Scenic Riverways, Big Spring (nps.gov); NPS Ozark National Scenic Riverways, Geologic Formations (nps.gov); Barr 2009, Effects of the upper Taum Sauk Reservoir embankment breach (USGS SIR 2009-5111) (pubs.usgs.gov)
The Current River and Big Spring, Water Year 2026: A Real Missouri Discharge Record for the Stream-Table Lab
USGS NWIS daily values, station 07067000 Current River at Van Buren, MO and station 07067500 Big Spring near Van Buren, MO, parameter 00060 (discharge, ft3/s), 2025-10-01 to 2026-09-30 (365 days; provisional from 2026-08-18); USGS SIR 2011-5200; NPS Ozark National Scenic Riverways springs page; retrieved November 6, 2026 · Public domain (works of the United States government), with SLS original worked computations
Why this reading. Option C of the stream-table lab uses the public record of a real river, and a record fetched live can be down on the day you need it. Here is a dated snapshot of the Current River at Van Buren and of Big Spring, which joins the river a few miles downstream, from the U.S. Geological Survey’s gages, for the water year that ended September 30, 2026. The lesson’s Option B table is also worked below, so that the graph of sediment against slope can be drawn from the page.
Table 1. Daily mean discharge by month, water year 2026
USGS station 07067000, Current River at Van Buren, Missouri, and USGS station 07067500, Big Spring near Van Buren, Missouri. A water year runs October 1 to September 30. Values are daily means in cubic feet per second (ft3/s); the USGS marks values from mid-August 2026 on as provisional until reviewed. Retrieved November 6, 2026.
| Month | Current River at Van Buren (ft3/s) | Big Spring (ft3/s) | ||||
|---|---|---|---|---|---|---|
| Mean | Highest day | Lowest day | Mean | Highest day | Lowest day | |
| October 2025 | 1,104 | 1,220 | 1,060 | 391 | 421 | 372 |
| November 2025 | 1,286 | 2,340 | 1,040 | 358 | 395 | 347 |
| December 2025 | 1,106 | 1,320 | 992 | 333 | 348 | 324 |
| January 2026 | 970 | 1,010 | 940 | 327 | 330 | 325 |
| February 2026 | 1,223 | 2,610 | 930 | 342 | 407 | 329 |
| March 2026 | 2,727 | 9,330 | 1,060 | 478 | 734 | 336 |
| April 2026 | 2,308 | 6,410 | 1,140 | 397 | 530 | 363 |
| May 2026 | 1,542 | 3,550 | 1,090 | 404 | 512 | 365 |
| June 2026 | 1,455 | 2,830 | 1,080 | 370 | 430 | 354 |
| July 2026 | 1,017 | 1,480 | 864 | 340 | 357 | 308 |
| August 2026 | 950 | 1,880 | 786 | 307 | 327 | 291 |
| September 2026 | 763 | 784 | 745 | 303 | 321 | 291 |
The extremes. Current River: highest daily mean 9,330 ft3/s on March 8, 2026, after heavy rain; lowest 745 ft3/s on September 30, 2026. One cubic foot is 0.028317 m3, so these are 264.2 m3/s and 21.1 m3/s. The ratio is 9,330 / 745 = 12.5. Big Spring peaked the same day at 734 ft3/s (a value the USGS marks as estimated) and fell to 291 ft3/s on August 14 and again on September 30: a ratio of only 2.52. The year’s mean flows were 1,371 ft3/s for the river and 363 ft3/s (10.3 m3/s) for Big Spring. The National Park Service gives Big Spring’s long-term average as about 289 million gallons a day, about 447 ft3/s, so 2026 was a below-average year for the spring.
What the ratio means
Discharge is Q = area × velocity, so a 12.5-fold change in Q comes partly from a deeper, wider channel and partly from faster water. Since the grain size flowing water can move rises with its speed, most of the year’s gravel moves in the few days of high water, such as the March storm. Even so, the Current River never drops very low: large springs, including those along the Current and Jacks Fork upstream of Van Buren, feed it steadily from groundwater stored in the dissolved-out dolomite. A river fed mostly by runoff from the land surface can carry hundreds of times more water on its biggest day than on its smallest. If you use this record for Option C, your independent variable is the season, not the slope, so you can conclude how discharge controls transport but not how slope does; say so.
The worked discharge, checked. A channel 20 m wide and 1.5 m deep at 1.2 m/s: Q = 20 × 1.5 × 1.2 = 36 m3/s. At 500 mg/L of suspended sediment, 36,000 L/s × 0.5 g/L = 18,000 g/s = 18 kg/s; over a day, 18 × 86,400 = 1,555,200 kg = 1,555 metric tons. The quiz stream: 8 × 0.5 × 0.75 = 3.0 m3/s.
Table 2. The lesson’s Option B stream-table results, worked
Tray 80 cm long; slope = raise / length. Illustrative constructed data, as labeled in the lesson.
| Raise (cm) | Slope (%) | Slope (degrees) | Sand deposited, trial 1 (g) | Trial 2 (g) | Mean (g) | Difference between trials | Mean channel depth (mm) |
|---|---|---|---|---|---|---|---|
| 2 | 2.5 | 1.4 | 34 | 38 | 36 | 4 (11% of the mean) | 4.2 |
| 5 | 6.25 | 3.6 | 96 | 88 | 92 | 8 (9% of the mean) | 9.5 |
| 10 | 12.5 | 7.1 | 205 | 221 | 213 | 16 (8% of the mean) | 17.5 |
Slope in degrees is tan−1(raise / 80). Doubling the slope from 6.25% to 12.5% more than doubled the sand moved (92 to 213 g), and the two trials at each slope differ by about a tenth of their mean, so the trend is far larger than the scatter: the conclusion is reliable at these three slopes, and no more than that. The deposit at the tray’s lower end, where the current spread into standing water and slowed, models a delta; where a steep channel opens onto a flat floor without standing water, the same slowing builds an alluvial fan.
Dams and sediment (USGS)
Heimann, Sprague and Blevins (USGS, 2011) analyzed suspended sediment in the Mississippi River basin from 1950 to 2009: loads generally went down; the Missouri River has historically carried the largest annual suspended-sediment load of the major subbasins; and “the closure of Fort Randall Dam in the upper Missouri River in 1952 was the single largest event in the recorded historical decline.” Below the dams, scour of the main channel is likely the largest source of suspended sand in the lower Missouri River: the river, deprived of sediment from upstream, takes it from its own bed.
Reading the gage
The USGS does not measure discharge directly every day. It measures the water level (gage height) continuously and converts it with a rating curve built from many direct measurements of width, depth and velocity across the channel, the same Q = area × velocity you use. That is why recent values are “provisional” and a few are “estimated”: the rating is rechecked, and values can be revised. When you cite this record, give the station number, the parameter (00060, discharge) and the retrieval date as the source line above does.
Sources: USGS monitoring location 07067000, Current River at Van Buren, MO (waterdata.usgs.gov); USGS monitoring location 07067500, Big Spring near Van Buren, MO (waterdata.usgs.gov); USGS NWIS daily values web service (query used for Table 1) (waterservices.usgs.gov); Heimann, Sprague and Blevins 2011, Trends in suspended-sediment loads and concentrations in the Mississippi River Basin, 1950-2009 (USGS SIR 2011-5200) (pubs.usgs.gov); NPS Ozark National Scenic Riverways, Springs and Seeps (nps.gov)
Taum Sauk as the USGS Measured It, the Ozark Gravel Story, and a Recorded Angle-of-Repose Run
Rydlund 2006, USGS SIR 2006-5284 (abstract); Barr 2009, USGS SIR 2009-5111 (abstract); Jacobson and Primm, Historical land-use changes and potential effects on stream disturbance in the Ozark Plateaus, Missouri, USGS Water-Supply Paper 2484 (abstract); Jacobson and Gran 1999, Gravel sediment routing from widespread, low-intensity landscape disturbance, Current River basin, Missouri (abstract); Missouri State Parks, Natural Features – Johnson’s Shut-Ins; Association of State Dam Safety Officials, Taum Sauk case study; retrieved November 6, 2026; SLS original illustrative angle-of-repose record · Public domain (works of the United States government), with Missouri State Parks and Association of State Dam Safety Officials information quoted briefly and an SLS original lab record and computations
Why this reading. The lesson’s argument asks what put the excess gravel into Ozark streams, and it must use evidence from the angle-of-repose lab, a factor-of-safety calculation and the land-use chain. The lesson’s opening event is the 2005 Taum Sauk reservoir breach. Here are both as U.S. Geological Survey scientists published them, a completed angle-of-repose run for students without sand, and every factor-of-safety figure in the lesson recomputed. Retrieved November 6, 2026.
A human impact first
The Association of State Dam Safety Officials’ case study: the flood “destroyed 281 acres of Johnson’s Shut-Ins State Park and ripped the superintendent’s home from its base. By chance alone, loss of life was averted and only four people sustained injuries.” The reservoir “failed by overtopping during the final minutes of one of its pumping cycles”, releasing its 4,300 acre-feet in 25 minutes.
Table 1. The Taum Sauk breach, December 14, 2005, as the USGS measured it
| Quantity | Value | Source |
|---|---|---|
| The structure | A 55-acre upper reservoir holding 1.5 billion gallons, built on top of Proffit Mountain about 760 feet above the floodplain of the East Fork Black River | Rydlund 2006 |
| The failure | At about 5:16 a.m., a 680-foot-wide section of the embankment “failed suddenly” | Rydlund 2006 |
| Peak flow | 289,000 ft3/s on Proffit Mountain (8,184 m3/s); 95,000 ft3/s on the East Fork Black River (2,690 m3/s) | Rydlund 2006 (indirect measurement) |
| Compared with natural floods | About 4 times the East Fork’s 100-year flood (21,900 ft3/s) and about 3 times its 500-year flood (30,500 ft3/s): 95,000 / 21,900 = 4.3; 95,000 / 30,500 = 3.1 | Rydlund 2006 |
| Speed and depth | Modeled velocities 20 to 51 ft/s on the mountainside (6.1 to 15.5 m/s) and 12 to 32 ft/s on the river; depths over 50 ft on Proffit Mountain; the water reached the floodplain in about 5.5 to 6 minutes | Rydlund 2006 |
| Damage | About 180 acres of timber affected; debris movement “extensive” down the mountain and through Johnson’s Shut-Ins State Park; “enormous quantities of rock, soil, and vegetation” deposited; very fine “rock flour” from scouring the mountainside may explain a blue-green color on the river for a year | Rydlund 2006; Barr 2009 |
| The case study’s figures | Breach 656 ft wide; peak 273,000 ft3/s; 4,300 acre-feet released in 25 minutes; 281 acres of the park destroyed; four people injured | Association of State Dam Safety Officials |
| Living things | The Johnson’s Shut-Ins fen, a wetland fed by groundwater, “was heavily damaged by the reservoir breach. It is uncertain to what extent it might recover.” | Missouri State Parks |
Note that the dam-safety case study gives a breach 656 feet wide and a peak of 273,000 ft3/s, while the USGS gives 680 feet and 289,000 ft3/s. Different teams measured in different ways; a careful account says which figure it is quoting.
The Ozark gravel story (USGS)
Jacobson and Primm (USGS Water-Supply Paper 2484) pieced together the history from records, stream deposits and oral histories:
| Period | What changed |
|---|---|
| Before settlement | Streams carried a mixed load of gravel and silty sediment; early explorers “conspicuously lack descriptions of extensive gravel bars.” |
| Early 1800s to about 1880 | Valley-bottom forest replaced by fields and pastures; wildfire suppression let woody understory grow on the uplands. |
| 1870s or 1880s to 1920 | Commercial logging of shortleaf pine for sawlogs and oak for railroad ties; clearing and road building in valley bottoms; extreme regional floods from 1895 to 1915 “probably caused initiation of moderate stream disturbance.” |
| 1920 to 1960 | Annual burning of uplands and cut-over slopes, more open-range grazing, more marginal land cultivated. Livestock concentrated in valley bottoms and “destroyed riparian vegetation in the channels and on banks”; oral histories say the gravel “came out of the runs, rather than from slopes.” |
| 1960 to 1993 | Fewer cultivated fields but more cattle; recovery helped by streamside vegetation “limited by channel instability and frequent, large floods.” |
Jacobson and Gran (1999) mapped gravel bars along 160 km of the Current River: excess gravel moves “in wave-like forms” through the basin, with smaller peaks of gravel area 1.8 to 4.1 km apart, and present-day land use is only weakly linked to where the gravel is now, because the gravel released decades ago is still traveling.
Table 2. Recorded angle-of-repose run
Constructed teaching data, not measurements of a particular student. Procedure as in the lab: 250 mL of play sand poured through a bottomless cup onto a tray, cup lifted slowly; height and base radius measured with a ruler; angle = tan−1(height / radius) and checked with a protractor. n = 3 cones per condition.
| Condition | Water added (mL) | Cone | Height (mm) | Base radius (mm) | Angle (°) | Mean angle (°) |
|---|---|---|---|---|---|---|
| Dry | 0 | 1 | 38 | 57 | 33.7 | 33.7 |
| 2 | 37 | 56 | 33.5 | |||
| 3 | 39 | 58 | 33.9 | |||
| Damp | 25 | 1 | 71 | 41 | 60.0 | 59.5 |
| 2 | 68 | 42 | 58.3 | |||
| 3 | 73 | 42 | 60.1 | |||
| Saturated | 75 | 1 | 21 | 68 | 17.2 | 17.7 |
| 2 | 23 | 70 | 18.2 | |||
| 3 | 22 | 69 | 17.7 |
The spray test: the damp cone (about 59°) took eleven sprays before its upper third slid off in one piece and spread into a low fan, and by the sixteenth spray the whole cone had slumped to a mound about 20° steep with water pooling at its edge. Read across the table: a little water made the stable angle 1.77 times as steep, surface tension in the thin films pulling the grains together; a lot of water cut it to about half the dry value (0.52), pore water pushing the grains apart and adding weight. The friction coefficient of the dry sand is tan(33.7°) = 0.67, which is the lab’s third analysis question and the μ to carry into a factor-of-safety calculation.
Every factor of safety in the lesson, recomputed
FS = μ cos θ / sin θ = μ / tan θ.
| Case | μ | θ | Computation | FS | Result |
|---|---|---|---|---|---|
| Mini-lecture, dry soil | 0.6 | 25° | 0.6 × 0.9063 / 0.4226 | 1.29 | Stable |
| Same slope, pore water removes 40% of the pressing force | 0.6 × 0.6 | 25° | 1.29 × 0.6 | 0.77 | Fails, angle unchanged |
| Steepest dry slope for μ = 0.6 | 0.6 | tan−1(0.6) | — | 1.00 | 31.0° |
| Quiz: steepest dry slope for μ = 0.7 | 0.7 | tan−1(0.7) | — | 1.00 | 35.0° |
| Lesson 4.5 example, dry | 0.7 | 30° | 0.7 × 0.8660 / 0.5000 | 1.21 | Stable |
| Lesson 4.5 example, saturated (40% loss) | 0.7 × 0.6 | 30° | 1.21 × 0.6 | 0.73 | Fails |
| The lab’s sand on a steep 30° Ozark hollow side, dry | 0.67 | 30° | 0.67 / 0.5774 | 1.16 | Barely stable |
| The same, saturated (40% loss) | 0.67 × 0.6 | 30° | 1.16 × 0.6 | 0.70 | Fails |
The chain, with the evidence at each link
| Link | Evidence |
|---|---|
| Clearing and grazing remove plants from banks and small valleys (biosphere to geosphere) | Logging to 1920; open-range livestock that destroyed riparian vegetation, 1920-60 (Jacobson and Primm) |
| Storm runoff erodes the weakened valleys (hydrosphere to geosphere) | Extreme floods 1895-1915; gravel “came out of the runs” (Jacobson and Primm) |
| Water lowers the factor of safety without changing the slope | Table 2: saturated sand stands at 17.7° against 33.7° dry; FS at 30° drops from 1.16 to 0.70 |
| Gravel travels through the network (geosphere and hydrosphere) | Wave-like gravel accumulations along 160 km of the Current River (Jacobson and Gran) |
| Recovery is slow (back to the biosphere) | Recovery aided by streamside vegetation is limited by channel instability and frequent floods (Jacobson and Primm) |
The rebuttal to “it was just the big floods”: Ozark streams had floods before settlement, yet early explorers did not describe extensive gravel bars; the USGS links the gravel to the land-use changes that weakened the valleys, with the floods of 1895-1915 as the trigger that came at a vulnerable time. The strongest honest version of the counter-claim is that the floods were extreme; the answer is that the land use is what turned extreme floods into a lasting change, and both were necessary.
Sources: Rydlund 2006, Peak discharge, flood profile, flood inundation, and debris movement accompanying the failure of the upper reservoir at the Taum Sauk pump storage facility (USGS SIR 2006-5284) (pubs.usgs.gov); Barr 2009, Effects of the upper Taum Sauk Reservoir embankment breach on surface-water quality and sediments (USGS SIR 2009-5111) (pubs.usgs.gov); Jacobson and Primm, Historical land-use changes and potential effects on stream disturbance in the Ozark Plateaus, Missouri (USGS WSP 2484) (pubs.usgs.gov); Jacobson and Gran 1999, Gravel sediment routing, Current River basin, Missouri (USGS) (pubs.usgs.gov); Association of State Dam Safety Officials, Dam Failure Case Study: Taum Sauk Dam (Missouri, 2005) (damsafety.org); Missouri State Parks, Natural Features – Johnson’s Shut-Ins (mostateparks.com)
Ice, Heat, Missouri Freeze-Thaw Days and Big Spring’s Dissolved Rock, With a Worked Chalk-and-Vinegar Run
USGS Water Science School ‘Water Density’ and ‘Specific Heat Capacity and Water’; Engineering ToolBox ice thermal properties; Robertson 1988 USGS OFR 88-441 Table 12; NOAA NCEI 1991-2020 U.S. Climate Normals (annual/seasonal) for USW00003945 and USW00013994; Water Quality Portal results for USGS-07067500 (hardness, calcium, magnesium, dissolved solids, 1973-2021); USGS NWIS daily discharge 07067500 water year 2026; NPS Ozark National Scenic Riverways springs and Big Spring pages; Missouri State Parks Elephant Rocks natural history; retrieved November 6, 2026; SLS original worked arithmetic and illustrative chalk-and-vinegar data · SLS original (cites USGS, NOAA and NPS public-domain data and Missouri State Parks and Engineering ToolBox published values; brief quotations only)
Why this reading. The mini-lecture states the ice-expansion percentage, the specific heat of water and granite, Missouri’s freeze-thaw days and Big Spring’s dissolved rock, and the lab’s data table is blank until you run it. Here are the published values behind those numbers, the arithmetic checked, and an illustrative run of the chalk-and-vinegar lab so the analysis can be answered even if your own cups have not finished drying. Retrieved November 6, 2026.
Table 1. Reference values, as published
| Quantity | Value | Source |
|---|---|---|
| Change on freezing | “Upon freezing, the density of ice decreases by about 9 percent”; ice is “about 90 percent” as dense as water | USGS Water Science School, Water Density |
| Density of ice | 916.2 kg/m3 at 0°C; 917.5 kg/m3 at −5°C | Engineering ToolBox, Ice thermal properties table |
| Specific heat of water | 4,184 J to warm 1 kg by 1°C (1 kilocalorie) | USGS Water Science School, Specific Heat Capacity and Water |
| Specific heat of granite | 0.65 to 0.80 × 10³ J/(kg·K) near 0°C, rising with temperature | Robertson 1988, USGS Open-File Report 88-441, Table 12 (from Goranson 1942) |
| Freezing nights and freezing days, Columbia Regional Airport, 1991-2020 normals | 101.1 days a year with a low at or below 32°F; 23.6 days with a high at or below 32°F | NOAA NCEI U.S. Climate Normals |
| The same, St. Louis Lambert International Airport | 84.9 and 19.3 days | NOAA NCEI U.S. Climate Normals |
Checking the mini-lecture’s numbers. A fixed mass of water takes up more space as ice in the ratio of the densities: 1 / 0.917 = 1.0905, about 9% more (1 / 0.9162 = 1.0915 at exactly 0°C). The 50 cm3 example: 50 / 0.917 = 54.5 cm3. For heat: 4,184 / 790 = 5.3 and 4,184 / 800 = 5.2, so “roughly five times” is fair for granite near room temperature (granite’s lowest listed value, 650, would make it 6.4). Freeze-thaw days. Every day whose high stays at or below freezing also has a low at or below freezing, so the days that freeze and then thaw are about 101.1 − 23.6 = 77.5 a year at Columbia and 84.9 − 19.3 = 65.6 at St. Louis. (This is an estimate: a few days have a high just above 32°F without real thawing in shaded cracks.)
Big Spring’s dissolved rock, computed from USGS samples
The USGS has sampled Big Spring (station 07067500) since 1973. Across 103 samples from 1973 to 2021 (Water Quality Portal), the median hardness, the calcium and magnesium dissolved from limestone and dolomite expressed as calcium carbonate, is 173 mg/L; the median dissolved calcium is 35.3 mg/L and magnesium 20.6 mg/L. The magnesium is the signature of dolomite.
Worked. Mean flow in water year 2026: 362.8 ft3/s × 28.317 L/ft3 = 10,272 L/s. × 0.173 g/L = 1,777 g/s. × 86,400 s/day = 153.5 metric tons per day, about 154 t/day (169 short tons). Over a year that is 56,043 t; at dolomite’s 2.84 t/m3, about 19,733 m3 of rock. The USGS’s own computed dissolved-solids loads for the spring have a median of 213 tons a day across 89 measurements, because they count everything dissolved and are taken at whatever the flow was that day.
Check the claims. The National Park Service’s springs page quotes one researcher’s estimate of about 175 tons of rock a day, close to our numbers, and its Big Spring page says 70 tons, which is lower than any of them. The springs page adds that a year’s rock would make a cavern 30 feet high, 50 feet wide and one mile long; that is about 224,269 m3. Our 19,733 m3 a year would fill a passage of that cross-section only about 142 m (465 feet) long, roughly a tenth of a mile. Published numbers are worth recomputing: the daily tonnage is well supported, the one-mile cavern is not.
Table 2. Illustrative chalk-and-vinegar run (SLS original, worked so the analysis can be answered without a live lab)
Four sticks of calcium-carbonate chalk, each started at 5.00 g, 100 mL of liquid, 10 minutes of contact, then blotted and air-dried overnight before the final weighing, following the lesson’s own procedure.
| Cup | Chalk form | Liquid | Start mass (g) | Final dry mass (g) | Mass lost (%) | Observations |
|---|---|---|---|---|---|---|
| A | Whole | Water | 5.00 | 4.96 | 0.8 | No fizzing; a faint chalky cloudiness in the water |
| B | Whole | Vinegar | 5.00 | 3.85 | 23.0 | Steady fine fizzing over the full 10 minutes; edges rounded |
| C | Crushed | Vinegar | 5.00 | 1.75 | 65.0 | Vigorous fizzing in the first 2 minutes, slowing as vinegar was used up; cloudy white liquid |
| D | Crushed | Water | 5.00 | 4.90 | 2.0 | No fizzing; slightly more cloudiness than cup A |
Reading the table as evidence. Percent mass lost is (start − final) / start × 100. Whole chalk in vinegar (B, 23.0%) lost far more than whole chalk in water (A, 0.8%): that isolates acidity, since surface area is the same in both. Crushed chalk in vinegar (C, 65.0%) lost far more than whole chalk in vinegar (B, 23.0%): that isolates surface area, since acidity is the same in both. Comparing C with A shows what both factors do together. Crushed chalk in water (D, 2.0%) shows surface area has a small effect even without acid. In this run, adding acid to whole chalk raised the loss by 22.2 percentage points (A to B), and crushing on top of acid added another 42.0 points (B to C), so surface area did more of the work here; check whether your own cups agree, since home runs vary with how finely the chalk was crushed and how completely it was drained.
Why limestone and dolomite still dissolve in weak rainwater
Vinegar (about 5% acetic acid) is far more acidic than rainwater, which is only weakly acidic from dissolved carbon dioxide; water soaking through soil picks up more carbon dioxide and becomes more acidic. The same reaction runs in both. Rainwater’s advantage is time, not strength: a cave wall or a gravestone is exposed for centuries, and the water is renewed by every rain, so a very slow reaction removes a measurable thickness over decades. Big Spring shows the result at the scale of a landscape: well over a hundred tons a day.
Frost and water at Elephant Rocks (Missouri State Parks)
The park describes the whole sequence: joints that opened as erosion removed the overlying rock; water moving down the fractures that “disintegrated the adjacent granite and rounded the edges and corners of the blocks while still underground”; core stones exposed by erosion; and today, rainwater that freezes in small fractures, lichens that produce “a weak organic acid that dissolves the rock,” and solution pans that hold water and so help both freeze-thaw and lichen growth. That is physical and chemical weathering speeding each other up, which is the link the modeling task asks you to draw.
Sources: USGS Water Science School, Water Density (usgs.gov); USGS Water Science School, Specific Heat Capacity and Water (usgs.gov); Engineering ToolBox, Ice – Thermal Properties (engineeringtoolbox.com); Robertson, E.C., 1988, Thermal Properties of Rocks, USGS Open-File Report 88-441 (pubs.usgs.gov); NOAA NCEI, U.S. Climate Normals 1991-2020, annual/seasonal (Columbia and St. Louis) (ncei.noaa.gov); Water Quality Portal, USGS-07067500 Big Spring near Van Buren, MO (waterqualitydata.us); NPS Ozark National Scenic Riverways, Springs and Seeps (nps.gov); NPS Ozark National Scenic Riverways, Big Spring (nps.gov); Missouri State Parks, Natural History – Elephant Rocks (mostateparks.com)