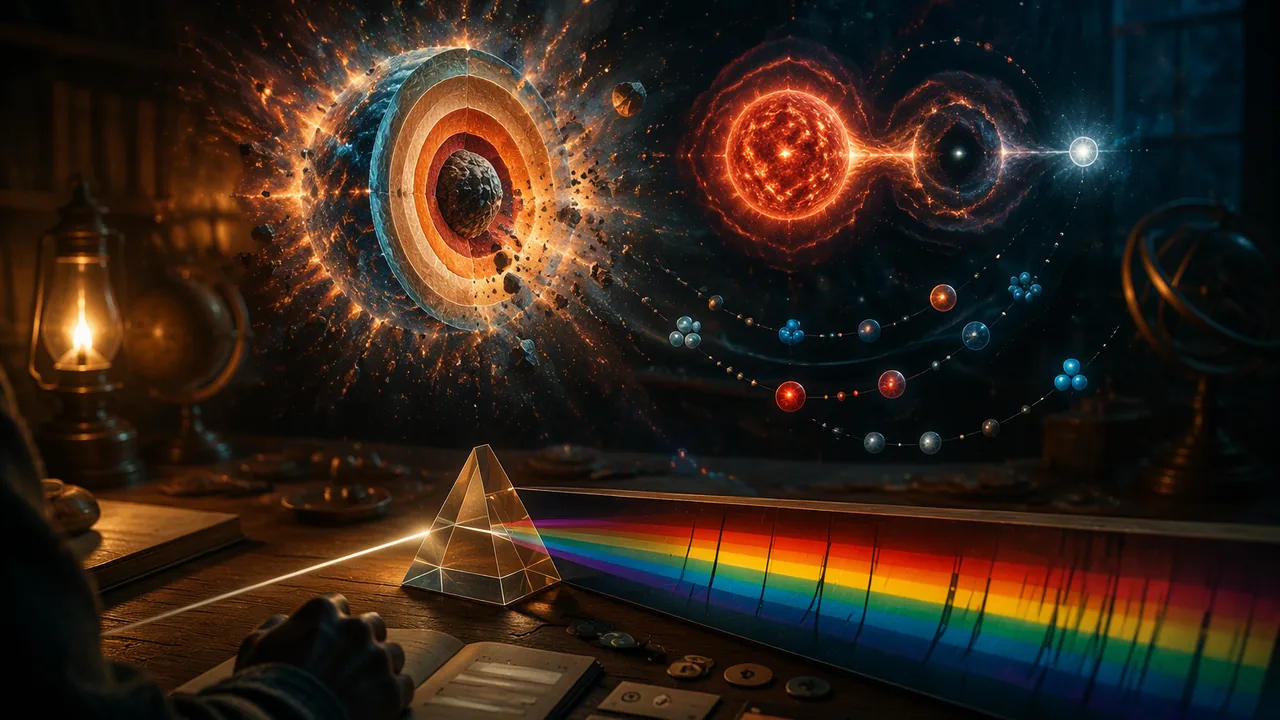
use spectra to identify what stars are made of and how hot they are, and model how stars of different masses produce elements over their life cycles.
Instruction
Reading starlight. We cannot visit a star, but its light carries two kinds of information. First, color gives temperature. A hot, dense object emits a continuous spectrum that peaks at a wavelength given by Wien’s law: λpeak = 2.898 × 10⁻³ m·K / T. The Sun’s surface at about 5,772 K peaks near 502 nm, in the blue-green, though we see the blend as white. A 3,000 K red dwarf peaks near 966 nm (infrared); a 25,000 K blue star peaks near 116 nm (ultraviolet). Second, dark or bright lines at particular wavelengths identify elements, because each element’s electrons absorb and emit only certain energies. Helium was discovered in the Sun’s spectrum in 1868 before anyone found it on Earth.
What stars make. The Big Bang made hydrogen, helium and a little lithium. Everything else was made in stars. A star is a balance between gravity pulling in and pressure pushing out, and its mass decides how far fusion can go.
- Sun-like stars fuse hydrogen to helium for about 10 billion years, then helium to carbon and oxygen as red giants. They gently shed their outer layers, returning some carbon and nitrogen to space, and end as white dwarfs.
- Massive stars (more than about 8 times the Sun’s mass) are hot enough in the core to keep going: carbon, neon, oxygen and silicon fuse in shells like an onion, ending with an iron core. They burn out in only millions of years.
Why iron is the end of the line. Iron-56 has among the most tightly bound nuclei. Fusing lighter nuclei up to iron releases energy; fusing iron into anything heavier absorbs energy. When the iron core of a massive star grows too large, nothing holds it up. It collapses in under a second, and the rebound blasts the star apart as a core-collapse supernova. The explosion scatters oxygen, silicon, calcium and iron into space, and the flood of neutrons builds some heavier nuclei.
Where lead and gold come from. Beyond iron, nuclei grow by capturing neutrons, which have no charge to be repelled, and some of those neutrons then turn into protons by beta decay. Slow neutron capture (the s-process) works over thousands of years in aging giant stars of low and intermediate mass, called asymptotic giant branch (AGB) stars. It climbs the table of nuclei one neutron at a time and stops at lead and bismuth, because one more neutron on bismuth makes polonium, which falls apart. Low-mass AGB stars are thought to be the Galaxy’s main source of lead. Many of the heaviest elements, including gold, platinum, thorium and uranium, need a very rapid capture of neutrons instead (the r-process). On August 17, 2017, gravitational-wave detectors recorded two neutron stars merging (event GW170817), and telescopes then watched the glowing debris, a kilonova, whose spectrum showed signs of freshly made heavy elements. Astronomers now think neutron-star mergers make much of the universe’s gold, with some rare kinds of supernova possibly contributing. This is current research, and the exact share is still debated.
Scale and cycling. The gas cloud that formed our solar system 4.6 billion years ago had already been enriched by generations of earlier stars. That is how the lead in Missouri’s galena, the calcium in your bones and the oxygen you breathe came to be here: matter cycles from stars to gas clouds to new stars and planets. Your model today shows those flows.
📖 Read for this lesson
The reading opens over the lesson; close it to come back to exactly where you were. The checks below draw on it.
Lab: Build a Spectroscope and Read Light Sources
Question. Do different light sources produce continuous spectra or line spectra, and what does that tell us about the source?
Materials
- An old CD or DVD (or a diffraction-grating slide)
- A cardboard tube or small box (a cereal box works)
- Two pieces of opaque card or aluminum foil and tape, to make a narrow slit
- Scissors
- Colored pencils
- Three light sources you can find at home: an incandescent or halogen bulb (a desk lamp, an oven light or a flashlight with a filament bulb), a white LED (a phone flashlight, an LED lamp or an LED flashlight) and a fluorescent tube or compact fluorescent lamp (still common in garages, kitchens, basements and stairwells). If you cannot find all three, use Option B or C in the alternative below.
- Never look at the Sun, directly or through the spectroscope. It can permanently damage your eyes.
- Scissors: cut away from your body. Trimming the CD is optional; a whole disc works. If you do trim one, have an adult cut it, because broken CD edges are sharp.
- Do not touch lamps: bulbs get hot. A broken fluorescent tube or bulb contains mercury: do not touch or vacuum it. Have people and pets leave the room, open a window to air it out for 5-10 minutes, and let an adult clean up following the EPA’s broken-bulb instructions (epa.gov/cfl).
Procedure
- Tape two card edges across one end of the tube, leaving a slit about 1 mm wide.
- Fix the CD (shiny side toward the slit) at the other end at about a 45° angle, with a viewing hole cut in the side of the box so you can see the CD.
- Point the slit at the incandescent bulb. Tilt until a rainbow appears. Sketch the colors in order and note whether any gaps or bright lines appear.
- Repeat for the white LED and the fluorescent lamp. Sketch each spectrum at the same scale.
- Compare your sketches with the reference wavelengths in the data section below, and decide which of your sources produced lines that match mercury.
Data
Analysis
- Claim: which source produced a line spectrum? Use your sketches as evidence and explain what kind of source produces lines (a gas whose atoms emit only certain energies).
- The fluorescent lamp’s bright green and violet lines match mercury. Explain how astronomers use the same reasoning to find the composition of a star they can never visit.
- Sources of error: how might slit width, stray room light or the angle of the CD affect what you saw?
If you cannot do this lab in person: Choose one. All three earn full credit and end in the same three sketches, the same continuous-or-line classification and the same claim-evidence-reasoning paragraph. Option A — build the spectroscope. The procedure above, with an old CD and a cereal box. Option B — the three spectra described here. No equipment and no internet. Three sources were viewed through the same CD spectroscope. Source 1: an unbroken band of color from deep red through orange, yellow, green and blue to violet, brightest at the red end, with no gaps and no sharp lines. Source 2: also unbroken, but dim in the deep red, with one broad bright region in the blue near 450 nm and a second broad bright region spread across yellow and green; still no sharp lines. Source 3: a faint continuous background crossed by four sharp bright lines, at about 405 nm violet, 436 nm blue, 546 nm green and a close yellow pair near 577 and 579 nm. Sketch all three from these descriptions on a common wavelength scale, decide which is the incandescent bulb, which the white LED and which the fluorescent lamp, classify each as continuous or line, and answer every analysis question. Answer the sources-of-error question as a prediction: say what a wider slit or stray room light would have done to each of these three spectra. Option C — the NIST line lists in this lesson’s reading. Use Tables 1-3 of this lesson’s hosted reading, NIST’s own published line lists for hydrogen, helium and mercury, retrieved in advance so the option needs no internet. Record the four strongest lines for each of H I, He I and Hg I and draw the three line spectra to scale on one wavelength axis. Those three gases replace the three household sources: classify each spectrum, explain which household lamp should match which gas and why, and answer the analysis questions from the tables instead of from a sketch. Cite the reading and its retrieval date.
Formative check
Work through these before moving on. They are not graded — they tell you whether the standard below has landed yet.
Simulation & tools
Temperature and the color of stars
Use the presets or the slider to set the temperature to the Sun (about 5,800 K), then to 3,000 K and to 10,000 K. For each, record the peak wavelength shown by the sim and whether the peak is in the infrared, visible or ultraviolet. Check each against Wien’s law, λ = 2.898 × 10⁻³ / T. Then answer: why does Betelgeuse look red and Rigel look blue-white?
No sim? Compute the three peak wavelengths with Wien’s law and place them on a wavelength scale you draw yourself, marked with these boundaries: ultraviolet below 380 nm, visible 380-750 nm (violet 380-450, blue 450-495, green 495-570, yellow 570-590, orange 590-620, red 620-750), infrared above 750 nm. Then answer the same question about Betelgeuse and Rigel.
Open in a new tab ↗ · PhET Interactive Simulations, University of Colorado Boulder · CC BY 4.0
Simulation & tools
Find a red star and a blue star tonight
Set your location to your Missouri town and tonight’s date, 9 p.m. Search for Betelgeuse or Antares (red supergiants) and Rigel or Vega (hot, blue-white stars), whichever are above the horizon. Record each star’s color, magnitude and whether it is up. Which will end as a supernova, and why can you tell from its type?
Choose one. All three earn full credit and answer the same questions. Option A is Stellarium Web above. Option B is to go outside on a clear evening and find whichever of these four stars is up, using the months in the table to know what to look for, and record its color with your own eyes. Option C, for no device and no clear sky, is the table itself.
| Star | Constellation | Spectral type and luminosity class | Apparent magnitude | Color | Best Missouri evenings at 9 p.m. |
|---|---|---|---|---|---|
| Betelgeuse | Orion | M1-2 Ia, red supergiant | about 0.5, variable | orange-red | December to March |
| Rigel | Orion | B8 Ia, blue supergiant | about 0.13 | blue-white | December to March |
| Antares | Scorpius | M1.5 Iab, red supergiant | about 1.0, variable | orange-red | June to August |
| Vega | Lyra | A0 V, main sequence | 0.03 | blue-white | July to October |
These are standard catalog values; you can check every one of them in Stellarium Web yourself. Careful with the supernova question: color is not what settles it. The three supergiants (luminosity class I) are massive enough to build an iron core and end as supernovae, whether they look red or blue-white. Vega is an ordinary main-sequence star of about two solar masses and will end as a white dwarf. Say in your answer which piece of the type code told you.
Open Stellarium Web ↗ · Stellarium Web · AGPL open source
Why can’t a massive star keep releasing energy by fusing its iron core into heavier elements?
Big Bang
Tap to revealHydrogen, helium and a trace of lithium
Sun-like star
Tap to revealHelium, then carbon and oxygen; ends as a white dwarf
Massive star
Tap to revealCarbon to iron in shells; ends in a supernova
Aging giant star (AGB)
Tap to revealSlow neutron capture (s-process): elements beyond iron, up to lead and bismuth
Neutron-star merger
Tap to revealMuch of the gold, platinum, thorium and uranium (r-process)
How confident are you that you can explain how stars of different masses produce elements and how spectra reveal them?
Practice
Work these on paper or in your notebook, then open Check your answer. Aim for all of Fluency and Application; try at least one Challenge.
Printable version: this unit’s practice workbook (PDF)
Fluency
Build speed and accuracy with the core skill.
- A radio or wireless signal has frequency 101.7 MHz. Using c = 3.0 × 10⁸ m/s, find its wavelength.
Check your answer
Answer: ≈ 2.950 mλ = c/f; convert MHz to Hz first. - A wave has frequency 1000 Hz and wavelength 3.4 m. What is its speed?
Check your answer
Answer: 3,400.00 m/sv = fλ. - Use Wien’s law to find the peak wavelength of the Sun’s surface at 5,772 K.
Check your answer
Answer: about 502 nm (blue-green)λ = 2.898 × 10⁻³ / 5,772 m. - A red dwarf has a surface temperature of 3,000 K. Where does its spectrum peak?
Check your answer
Answer: about 966 nm, in the near infraredλ = 2.898 × 10⁻³ / 3,000 m. - A star’s spectrum peaks at 290 nm. What is its surface temperature?
Check your answer
Answer: about 9,993 KT = 2.898 × 10⁻³ / 2.90 × 10⁻⁷.
Application
Use the skill in context. Show your reasoning.
- Betelgeuse’s surface is roughly 3,600 K and Rigel’s roughly 12,100 K (approximate values). Find each peak wavelength and explain the stars’ colors.
Check your answer
Answer: Betelgeuse about 805 nm (infrared, looks red); Rigel about 240 nm (ultraviolet, looks blue-white)Apply Wien’s law to each temperature. - A fluorescent lamp shows bright green and violet lines, but an incandescent bulb shows a continuous rainbow. What kind of source makes each, and what can the lines tell an astronomer about a star?
Check your answer
Answer: Lines come from a gas whose atoms emit only certain wavelengths (here mercury); a hot, dense filament gives a continuous spectrum. Lines in starlight identify the elements in the star’s outer layers. - Name the event that made each: carbon in your body, most of the helium in the universe, the iron in your blood, the gold in a ring, the lead in a cube of Missouri galena.
Check your answer
Answer: Most helium: the Big Bang. Carbon: helium fusion in red giants. Iron: fusion in massive stars, spread by supernovae. Gold: rapid neutron capture, largely in neutron-star mergers. Lead: mostly slow neutron capture in aging low-mass giant stars (the s-process ends at lead and bismuth), plus lead from the decay of uranium and thorium made by rapid neutron capture.
Challenge
Stretch problems. Expect to think before you write.
- By the Stefan-Boltzmann law, each square meter of a star emits power proportional to T4. How many times more power per square meter does a 11,544 K star emit than the 5,772 K Sun?
Check your answer
Answer: 16 times(11,544 / 5,772)4 = 24 = 16.
Review
Keep earlier skills sharp.
- A sample has mass 179.2 g and volume 20.0 cm3. Find its density and, using a density table, suggest what it could be.
Check your answer
Answer: 8.96 g/cm3, consistent with copper (8.96 g/cm3)Density = mass / volume. - Convert 1250 mL to L.
Check your answer
Answer: 1.25 L
NIST’s Line Lists for Hydrogen, Helium and Mercury, Wien’s Law Checked, and the 2017 Kilonova
NIST Atomic Spectra Database, Lines query for H I, He I and Hg I, 380-750 nm, observed wavelengths and relative intensities, retrieved September 23, 2026; CODATA 2022 Wien constant; NASA news release of October 16, 2017 on GW170817 · Public domain (works of the United States government), with SLS original worked computations
Why this reading. Option C of the spectroscope lab needs the NIST line lists; here they are, so the option works with no internet. The blackbody task needs Wien’s law checked against real temperatures; the checks are worked below. And the gold story needs the evidence for GW170817 as NASA reported it. The line tables are the data; the intensities are NIST’s relative values on an arbitrary scale, useful only for comparing lines of the same element.
Table 1. Hydrogen (H I), visible lines from NIST
Observed wavelengths in air, nanometers, with NIST relative intensity. The four brightest are the Balmer lines a hydrogen lamp shows.
| Wavelength (nm) | Relative intensity | Color | Name |
|---|---|---|---|
| 656.279 | 500,000 | red | H-alpha |
| 486.135 | 180,000 | blue-green | H-beta |
| 434.047 | 90,000 | violet-blue | H-gamma |
| 410.173 | 70,000 | violet | H-delta |
| 397.008 | 30,000 | violet (edge of vision) | H-epsilon |
| 388.906 | 70,000 | near-ultraviolet | H-zeta |
Table 2. Helium (He I), strongest visible lines from NIST
| Wavelength (nm) | Relative intensity | Color |
|---|---|---|
| 587.562 | 500 | yellow (the line found in the Sun in 1868) |
| 706.519 | 200 | deep red |
| 447.148 | 200 | blue |
| 501.568 | 100 | green |
| 667.815 | 100 | red |
| 388.865 | 500 | near-ultraviolet, not visible |
Table 3. Mercury (Hg I), strongest visible lines from NIST
The gas inside every fluorescent tube and compact fluorescent lamp.
| Wavelength (nm) | Relative intensity | Color |
|---|---|---|
| 404.657 | 12,000 | violet |
| 435.834 | 12,000 | blue |
| 546.075 | 6,000 | green |
| 576.961 | 1,000 | yellow |
| 579.067 | 900 | yellow (the close pair with 576.961) |
| 407.784 | 1,000 | violet |
| 690.746 | 1,000 | red (faint in most lamps) |
| 567.581 | 600 | yellow-green |
Compare Table 3 with Option B’s Source 3: sharp lines at about 405, 436 and 546 nm with a close yellow pair near 577 and 579. That is mercury, line for line. A fluorescent lamp also shows a faint continuous background and extra lines from the phosphor coating, which is why a real sketch is never as clean as the database. Hydrogen and helium are not in household lamps; astronomers see their lines in stars, and Table 1 is why the Sun’s spectrum shows a dark line at 656.3 nm and why a galaxy’s redshift is measured against it (Lesson 1.3).
Wien’s law against real temperatures
The CODATA 2022 value of the Wien displacement constant is b = 2.897771955 × 10⁻³ m·K (exact). Peak wavelength = b/T.
| Object and temperature | Computation | Peak wavelength | Band |
|---|---|---|---|
| Sun, 5,772 K (NASA effective temperature) | 2.8978 × 10⁻³ / 5,772 | 502.0 nm | visible, blue-green |
| The sim’s Sun preset, 5,800 K | 2.8978 × 10⁻³ / 5,800 | 499.6 nm | visible, blue-green |
| Red dwarf, 3,000 K | / 3,000 | 965.9 nm | infrared |
| Hot star, 10,000 K | / 10,000 | 289.8 nm | ultraviolet |
| Blue star, 25,000 K | / 25,000 | 115.9 nm | far ultraviolet |
These reproduce the mini-lecture’s 502, 966 and 116 nm. The no-sim route asks you to place the 5,800 K, 3,000 K and 10,000 K peaks on a wavelength scale: 500 nm sits in the green, 966 nm is beyond red (above 750 nm), 290 nm is below violet (under 380 nm). A star whose peak is in the infrared still emits some visible light, mostly at the red end, which is why Betelgeuse and Antares look orange-red; a star peaking in the ultraviolet spills into the violet and blue, which is why Rigel and Vega look blue-white.
GW170817 and the kilonova, as NASA reported it
NASA news release, October 16, 2017. On August 17, 2017, the LIGO and Virgo detectors recorded gravitational waves from two neutron stars merging, event GW170817. NASA’s Fermi telescope detected a gamma-ray burst from the same direction at 8:41 a.m. EDT, nearly simultaneously. The source was in the galaxy NGC 4993, about 130 million light-years away in the constellation Hydra. Swift, Hubble, Chandra and Spitzer then followed the fading glow, the kilonova; Chandra detected X-rays nine days later. NASA wrote that merging neutron stars “may be the universe’s dominant source for many of the heaviest elements, including platinum and gold”, and that Spitzer’s infrared data were expected to help measure how much gold was forged. The release gives no mass of gold. That is the honest state of the evidence for a grade 9 explanation: a merger was seen, its glow matched the predicted decay of freshly made heavy elements, and the exact share of the universe’s gold that comes from mergers is still being measured.
Reading the evidence
Three kinds of evidence appear on this page. The line lists are laboratory measurements: an element’s electrons emit only certain energies, so a set of lines identifies the element wherever it is. Wien’s law is a checked relation: the same formula fits the Sun and a lamp. The kilonova is one observed event interpreted through a model. When your flow model of element production draws an arrow from “neutron-star merger” to “gold”, label that arrow with GW170817 and the date, and mark it as current research.
Sources: NIST Atomic Spectra Database, Lines query form (physics.nist.gov); NIST CODATA 2022 Wien wavelength displacement law constant (physics.nist.gov); NASA, ‘NASA Missions Catch First Light from a Gravitational-Wave Event’, October 16, 2017 (nasa.gov); NASA Sun Fact Sheet (effective temperature) (nssdc.gsfc.nasa.gov)