calculate a slip rate from a dated offset, compare it with GPS rates, fit the Gutenberg-Richter relation to real USGS earthquake counts, and use the results to argue for or against claims about New Madrid earthquakes.
Instruction
A human impact first. Earthquakes are not only data. In 1811-1812 three earthquakes of magnitude 7.3 to 7.5 struck the region around New Madrid. The USGS records one death in falling buildings at New Madrid, and chimneys toppled as far away as St. Louis; few people lived in the region then, so the low toll reflects the population, not weak shaking. A false forecast can hurt too: in 1990 a self-promoted forecaster announced a 50-50 chance of a major New Madrid earthquake on December 3. Scientists reviewed the claim and found no scientific basis, yet schools and businesses closed and money was wasted. Every number below stands for shaking that people live through, or worry about. We study the numbers so that communities can prepare sensibly.
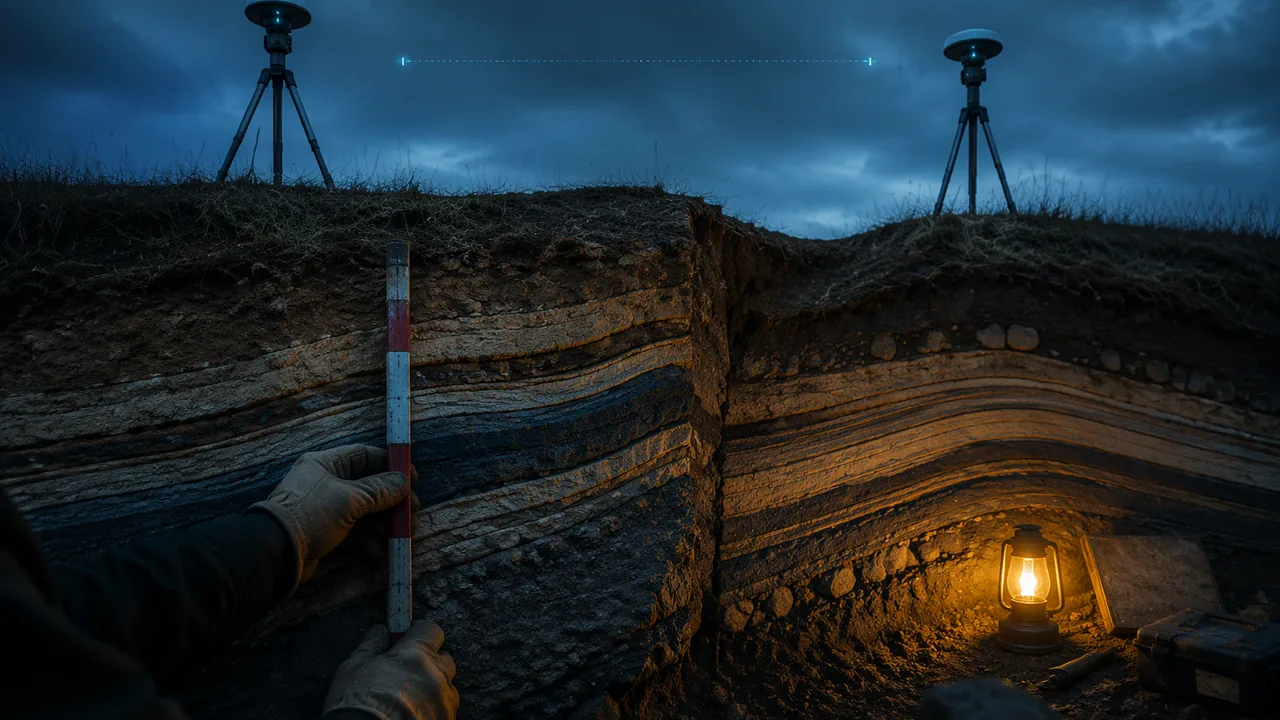
Slip rate from the Reelfoot scarp. The Reelfoot fault, which ruptured in February 1812, runs under a low ridge, the Reelfoot scarp, that crosses an abandoned Mississippi River channel near Tiptonville, Tennessee, just across the river from Missouri. Researchers dug trenches across it, measured how much the layers of river sediment were folded, and dated the folded sediment. They found about 45 ft (13.7 m) of slip in about 2,300 years. The average slip rate is 13.7 m / 2,300 yr = 0.0060 m/yr, about 6 mm per year.
The puzzle: GPS sees almost nothing. GPS stations across the zone, measured for years, move together. Calais and Stein (2009) found the ground around the fault system moving at less than 0.2 mm per year, possibly not at all, and you saw the same in Lesson 3.1. That is at least 30 times slower than the scarp’s 6 mm/yr. At a plate boundary, geological slip rates and GPS rates usually agree. Here two independent methods disagree, and that disagreement is the evidence: motion in the middle of a plate seems to switch on and off. Suppose each large New Madrid sequence needs the slip the Reelfoot fault stored at 6 mm/yr over a 500-year cycle, 6 × 500 = 3,000 mm, or 3 m. At 0.2 mm/yr, storing 3 m would take 3,000 / 0.2 = 15,000 years. Either the fault is using up strain stored long ago, or its activity is winding down, or it is loaded in a way GPS cannot yet see. Scientists forecast probabilities, not dates, because they cannot yet tell which.
The sand-blow record. Strong shaking turns waterlogged sand into a liquid that erupts through the surface and leaves sand blows. Tuttle and colleagues studied liquefaction features at more than 250 sites and dated very large earthquakes in about A.D. 900 (±100 years), about A.D. 1450 (±150 years) and 1811-1812. The time between them averages about 500 years, but could be as short as 200 or as long as 800.
Many small, few large: Gutenberg-Richter. The USGS catalog lists every earthquake it recorded in the box 35-38° N, 88-91° W (the New Madrid Seismic Zone with parts of Missouri, Arkansas, Tennessee, Kentucky and Illinois) from 2000 through 2024. The counts of events at or above each magnitude are:
| Magnitude ≥ | 2.0 | 2.5 | 3.0 | 3.5 | 4.0 | 4.5 |
|---|---|---|---|---|---|---|
| Count, 2000-2024 | 1,420 | 397 | 69 | 26 | 6 | 0 |
Each whole step in magnitude cuts the count by more than ten: 1,420 → 69 → 6. Plot log10(count) against magnitude and the points fall close to a line. A least-squares fit to magnitudes 2.0-4.0 gives log10N ≈ 5.52 − 1.19M, where N is the 25-year count. The slope, the b-value, is about 1.2, a little steeper than in most regions, so each step up in magnitude has about one-fifteenth as many earthquakes. Extending the line predicts about 0.38 earthquakes of magnitude 5 or more in 25 years, roughly one every 65 years, and a magnitude 7 only about once in 16,000 years. The sand blows show earthquakes of about magnitude 7 or larger roughly every 500 years. The small earthquakes alone badly underestimate the big ones here, which is why forecasts combine catalogs with the geological record.
Why many small quakes do not prevent a big one. Each magnitude step releases about 32 times more energy (101.5). A magnitude 7.5 like December 1811 releases 101.5 × 3.5 = 105.25 ≈ 178,000 times the energy of a magnitude 4.0 like Cooter’s. The zone had only six earthquakes of magnitude 4.0 or more in 25 years.
Forecasts, not predictions. The USGS estimates the chance of an earthquake similar to one of the 1811-1812 sequence in the next 50 years at about 7 to 10 percent, and the chance of a magnitude 6 or larger in 50 years at 25 to 40 percent. Your argument today will test claims against these numbers.
📖 Read for this lesson
The reading opens over the lesson; close it to come back to exactly where you were. The checks below draw on it.
Formative check
Work through these before moving on. They are not graded — they tell you whether the standard below has landed yet.
Simulation & tools
Fitting Gutenberg-Richter to USGS New Madrid counts
Open a new CODAP document and make a table with two columns, M and N, and enter the five USGS counts from the lesson (2.0: 1,420 through 4.0: 6). Add a formula column logN = log(N) (base 10). Make a graph of logN against M, then add a least-squares line. Record the slope and intercept, and compare them with 5.52 and −1.19. Use your line to predict the 25-year count of M ≥ 4.5 events and compare with the observed 0.
No device? Plot log10N against M on graph paper, draw the best line by eye through the five points, and read its slope from two points on the line.
Open in a new tab ↗ · CODAP, Concord Consortium · MIT open source
Folded river sediment along the Reelfoot fault, dated at about 2,300 years old, records about 13.7 m (45 ft) of fault slip. What is the average slip rate?
Frequent small earthquakes in the Bootheel release enough energy to prevent a large New Madrid earthquake.
The USGS counts show 1,420 earthquakes of M ≥ 2.0 in 25 years in the New Madrid box. If each step up in magnitude cut the count by ten, about how many of M ≥ 3.0 would you expect?
Choose one claim: (a) ‘New Madrid is overdue for the Big One, so it will happen this year’ (a claim like the 1990 forecast for December 3); (b) ‘The next New Madrid earthquake will split the country in two along the Mississippi’; (c) ‘Small earthquakes are good because they prevent big ones.’ Write a CER rebuttal that uses at least two calculations from this lesson (slip rates, the sand-blow intervals, Gutenberg-Richter or energy ratios) and the kind of motion on the Reelfoot fault. Then write the strongest point a believer in the claim could make and respond to it, in writing or on a recording.
How confident are you that you can calculate slip rates and use earthquake statistics to argue about New Madrid earthquake claims?
Practice
Work these on paper or in your notebook, then open Check your answer. Aim for all of Fluency and Application; try at least one Challenge.
Printable version: this unit’s practice workbook (PDF)
Fluency
Build speed and accuracy with the core skill.
- Compare a magnitude 6.0 earthquake with a magnitude 5.5 earthquake. About how many times larger is the ground-motion amplitude, and about how many times more energy is released?
Check your answer
Answer: amplitude ≈ 3.2 times; energy ≈ 5.6 timesEach whole step in magnitude is 10 times the amplitude and about 32 times (101.5) the energy. - Compare a magnitude 7.0 earthquake with a magnitude 6.0 earthquake. About how many times larger is the ground-motion amplitude, and about how many times more energy is released?
Check your answer
Answer: amplitude ≈ 10.0 times; energy ≈ 32 timesEach whole step in magnitude is 10 times the amplitude and about 32 times (101.5) the energy. - Compare a magnitude 5.5 earthquake with a magnitude 5.0 earthquake. About how many times larger is the ground-motion amplitude, and about how many times more energy is released?
Check your answer
Answer: amplitude ≈ 3.2 times; energy ≈ 5.6 timesEach whole step in magnitude is 10 times the amplitude and about 32 times (101.5) the energy. - A fence across a fault is offset 16 m over 500 years of steady creep. What is the creep rate in mm/yr?
Check your answer
Answer: 32 mm/yr
Application
Use the skill in context. Show your reasoning.
- The Reelfoot scarp records about 13.7 m of fault slip. At 6.0 mm/yr, how long did that slip take to accumulate?
Check your answer
Answer: about 2,283 years, close to the 2,300-year age of the folded sediment13.7 m / 0.0060 m per year. - Use log10N = 5.52 − 1.19M (25-year counts, USGS New Madrid box) to predict the number of M ≥ 3.5 earthquakes, and compare with the observed 26.
Check your answer
Answer: about 23, a little below the 26 observed5.52 − 1.19 × 3.5 = 1.355; 101.355 ≈ 22.6. - The USGS catalog lists 1,420 earthquakes of M ≥ 2.0 in the New Madrid box over 25 years. What is the average number per year and per week?
Check your answer
Answer: 56.8 per year; about 1.1 per week
Challenge
Stretch problems. Expect to think before you write.
- How many M4.0 earthquakes release the same energy as one M7.5, like the December 1811 shock? Compare with the 6 events of M ≥ 4.0 recorded in the New Madrid box in 25 years, and explain what this means for the claim that small earthquakes ‘relieve the pressure’.
Check your answer
Answer: About 178,000 (101.5 × 3.5 = 105.25); the zone had only 6 events of M ≥ 4.0 in 25 years, far too few to release the strain of a large earthquake.
Review
Keep earlier skills sharp.
- A wood sample has 35% of the carbon-14 of living wood. Using a half-life of 5,730 years, estimate its age.
Check your answer
Answer: ≈ 8,679 yearst = 5730 × log2(100/percent remaining). - Review (Unit 1): a satellite at a = 4 AU from the Sun has what period?
Check your answer
Answer: 8 years41.5.
The Reelfoot Scarp Slip Rate, GPS That Sees Almost Nothing, the Dated Sand Blows, and 25 Years of New Madrid Earthquakes Counted
University of Arkansas news release on Guccione, Mueller and others (Science 1999); Purdue University news release and abstract, Calais and Stein, Time-Variable Deformation in the New Madrid Seismic Zone (Science 2009); Stein, A GPS-based view of New Madrid earthquake hazard (USGS NSHM CEUS workshop, 2012); Tuttle and others 2002 (BSSA 92:2080) via USGS Publications Warehouse; USGS ComCat counts for 35-38 N, 88-91 W, 2000-2024; USGS Circular 1083 (1993); WTVG 13abc, Finding fault (December 4, 2020); all retrieved November 6, 2026 · SLS original (cites USGS public-domain data and publications and published research and news reports as facts; brief quotations only)
Why this reading. The lab asks you to rebut a popular New Madrid claim with at least two calculations. Here are the sources behind the lesson’s numbers: the Reelfoot scarp slip rate, the GPS result that disagrees with it, the dated sand blows, the catalog counts re-run on November 6, 2026 with the least-squares fit reproduced, and the 1990 forecast that the claims echo. The USGS 50-year probabilities are in the reading on the New Madrid USGS sources.
1. The Reelfoot scarp: a dated offset
A 1999 University of Arkansas news release on work by Margaret Guccione, Karl Mueller and colleagues (published in Science, 1999) describes trenches across the Reelfoot scarp, “a geologic fold that crosses an abandoned Mississippi River channel near Tiptonville, Tenn.” The team measured the widths of folded zones (“kink bands”) and dated the folded sediment, and found a slip rate of “about six millimeters per year over the past 2,300 years, totaling nearly 45 feet”; extending to the whole zone gave about 4.8 to 6.1 mm/yr. Check: 45 ft × 0.3048 = 13.7 m; 13,716 mm / 2,300 yr = 5.96 mm/yr; the lesson rounds to 6. Inverse: 13.7 m / 0.0060 m/yr = 2,283 years.
2. GPS: almost no motion
A 2009 Purdue University news release on Eric Calais and Seth Stein’s Science paper “Time-Variable Deformation in the New Madrid Seismic Zone” reports that “the ground surrounding the fault system is moving at a rate of less than 0.2 millimeters per year and there is likely no motion,” from nine GPS antennas in the zone. The paper’s abstract, printed in the release, says the zone “is currently deforming too slowly – if at all – to account for large earthquakes in the region over the past 5,000 years.” A 2012 presentation by Stein to a USGS hazard-mapping workshop adds that the recent earthquakes correspond to slip of at least 1-2 mm/yr over the past ~2,000 years, that at the GPS rate a magnitude 7 would be at least 10,000 years away, and that the lack of significant fault topography implies the recent pulse of activity is only a few thousand years old. Lesson 3.1’s own check: PTGV and RLAP differ by 0.29 ± 0.22 mm/yr.
The budget, worked. 6 mm/yr ÷ 0.2 mm/yr = 30, so the geological rate is at least 30 times the GPS rate. Slip stored at 6 mm/yr in a 500-year cycle: 6 × 500 = 3,000 mm = 3 m. Time to store 3 m at 0.2 mm/yr: 3,000 / 0.2 = 15,000 years, consistent with Stein’s “at least 10,000 years.”
3. The sand-blow record
Tuttle and others (2002), Bulletin of the Seismological Society of America 92:2080, abstract on the USGS Publications Warehouse: the fault system “has generated temporally clustered very large earthquakes in A.D. 900 ± 100 years and A.D. 1450 ± 150 years as well as in 1811–1812,” and “the time between the past three New Madrid events may be as short as 200 years and as long as 800 years, with an average of 500 years,” from liquefaction features “at more than 250 sites.” Check with the central dates: 1450 − 900 = 550 years; 1811 − 1450 = 361 years; two intervals over 911 years average 456 years. The published 500 allows for the dating uncertainties.
4. Table 1. The catalog counts
USGS ComCat via the FDSN event service, earthquakes only, 35-38°N, 88-91°W, January 1, 2000 through December 31, 2024, queried November 6, 2026. Counts at M ≥ 1.0 (6,288) and 1.5 (4,314) are left out of the fit because the network does not record every earthquake that small everywhere in the box.
| Magnitude ≥ | 2.0 | 2.5 | 3.0 | 3.5 | 4.0 | 4.5 |
|---|---|---|---|---|---|---|
| Count | 1,420 | 397 | 69 | 26 | 6 | 0 |
| log10(count) | 3.152 | 2.599 | 1.839 | 1.415 | 0.778 | — |
The six events of magnitude 4.0 or more: 2003-04-30 M4.0 near Blytheville, Arkansas; 2003-06-06 M4.0 near Bardwell, Kentucky; 2005-02-10 M4.1 near Etowah, Arkansas; 2005-05-01 M4.2 near Manila, Arkansas; 2005-06-02 M4.0 south of Ridgely, Tennessee; 2021-11-18 M4.0 south of Williamsville, Missouri. (The 2026 Cooter M4.0 falls after this window.)
The fit reproduced. Least squares on the five points gives log10N = 5.5159 − 1.1864M, which rounds to the lesson’s 5.52 − 1.19M. Predictions from the unrounded line: M ≥ 3.0, 90.5 (observed 69); M ≥ 3.5, 23.1 (observed 26); M ≥ 4.0, 5.89 (observed 6); M ≥ 4.5, 1.50 (observed 0); M ≥ 5.0, 0.38 in 25 years, one every 65 years; M ≥ 7.0, 0.0016, one every 15,382 years. With the rounded coefficients: M ≥ 3.0 gives 101.95 = 89; M ≥ 3.5 gives 101.355 = 22.6; M ≥ 4.0 gives 100.76 = 5.75; M ≥ 7.0 gives one every 16,100 years. The b-value, 1.19, means each magnitude step cuts the count by 101.19 ≈ 15.5. The sand blows record magnitude 7-size earthquakes about every 500 years, some 30 times more often than the line predicts: small earthquakes do not forecast the big ones here.
Rates. 1,420 events of M ≥ 2.0 in 25 years = 56.8 per year = 1.09 per week. Energy. M7.5 against M4.0: 101.5 × 3.5 = 105.25 = 177,828, about 178,000; amplitude 103.5 = 3,162.
5. The 1990 forecast
In 1990 Iben Browning, a business climatologist, gave a 50-50 chance of a major earthquake centered on New Madrid around December 3, 1990, based on tidal forces when the Sun and Moon lined up. The USGS later published a 248-page study of the public response, Responses to Iben Browning’s prediction of a 1990 New Madrid, Missouri, earthquake (Circular 1083, 1993). A 2020 WTVG (13abc) retrospective reports that a scientific review committee found the reasoning unsound, that no earthquake came, and that schools and mines closed; a geologist interviewed estimated losses “probably in the millions of dollars.”
Using this against the three claims
“Overdue, so it will happen this year”: the recurrence is 200 to 800 years with an average near 500, GPS shows the zone barely loading, and the USGS gives 7 to 10 percent for a repeat of 1811-1812 in 50 years; none of that is a date. “Split the country in two”: the Reelfoot fault is a thrust that pushes one block up over another by meters in a great earthquake and about 6 mm per year at its fastest; the rift failed 515 million years ago and is being squeezed, not pulled apart. “Small earthquakes prevent big ones”: one M7.5 releases the energy of about 178,000 M4.0 events, and the zone had six M4.0 or larger in 25 years.
Sources: University of Arkansas news, Research in New Madrid Seismic Zone points to possible earthquake threat (1999) (news.uark.edu); Purdue University news release, Calais and Stein, New Madrid (March 2009) (purdue.edu); Stein, A GPS-based view of New Madrid earthquake hazard (USGS National Seismic Hazard Model CEUS workshop, 2012) (earthquake.usgs.gov); Tuttle and others 2002, The earthquake potential of the New Madrid seismic zone (USGS Publications Warehouse) (pubs.usgs.gov); USGS FDSN event web service (count queries for Table 1) (earthquake.usgs.gov); USGS Circular 1083, Responses to Iben Browning’s prediction of a 1990 New Madrid, Missouri, earthquake (pubs.usgs.gov); WTVG 13abc, Finding fault: The failed Midwest earthquake prediction, 30 years later (2020) (13abc.com)
The USGS Sources to Summarize: The New Madrid Seismic Zone, the West Coast’s ShakeAlert, and Missouri’s Warning Channels
USGS, Summary of 1811-1812 New Madrid Earthquakes Sequence (October 2, 2019); USGS Fact Sheet 2009-3071, Earthquake Hazard in the New Madrid Seismic Zone Remains a Concern (August 2009); USGS ComCat earthquake catalog query, 2025, 35.5-37.5 N, 88.5-90.5 W; USGS Fact Sheet 2014-3083, version 1.2 (February 2017), ShakeAlert: An Earthquake Early Warning System for the United States West Coast; USGS image description, ShakeAlert Earthquake Early Warning Basics; USGS news release, Entire U.S. West Coast Now Has Access to ShakeAlert (May 4, 2021); NWS, Wireless Emergency Alerts; NWS, NOAA Weather Radio All Hazards, SAME and event-code pages; all retrieved November 5, 2026 · Public domain (works of the United States government)
Why this reading. The unit asks whether a warning could ever outrun the shaking from an earthquake in the New Madrid Seismic Zone, and the performance task says to use USGS pages as your primary sources and to cite no figure without a source and an access date. Here are those sources, quoted, each with its identifier and the date it was retrieved (November 5, 2026), so the explainer can be written from inside the lesson. Read them for three things: what happened in Missouri in 1811–1812 and what USGS says about the hazard now; how the West Coast’s ShakeAlert system works (your working model); and which warning channels already reach Missouri phones and radios.
1. The 1811–1812 New Madrid earthquakes
USGS, “Summary of 1811-1812 New Madrid Earthquakes Sequence” (October 2, 2019). The sequence is named “after the Missouri town that was the largest settlement on the Mississippi River between St. Louis, Missouri and Natchez, Mississippi.” The three principal shocks: “The first principal earthquake, M7.5, occurred at about 2:15 am (local time) in northeast Arkansas on December 16, 1811. The second principal shock, M7.3, occurred in Missouri on January 23, 1812, and the third, M7.5, on February 7, 1812, along the Reelfoot fault in Missouri and Tennessee.”
How far the waves reached: damaging shaking covered an estimated 600,000 square kilometers and the earthquakes were felt over about 5,000,000 square kilometers; “The area of strong shaking associated with these shocks is two to three times as large as that of the 1964 Alaska earthquake.” The human side: “Only one life was lost in falling buildings at New Madrid, but chimneys were toppled and log cabins were thrown down as far distant as Cincinnati, Ohio, St. Louis, Missouri, and in many places in Kentucky, Missouri, and Tennessee.” Few people lived in the region in 1811; the low toll reflects that, not small shaking. The ground itself changed: subsidence formed Reelfoot Lake in Tennessee, where the land dropped 1.5 to 6 meters.
2. The hazard now
USGS Fact Sheet 2009–3071, “Earthquake Hazard in the New Madrid Seismic Zone Remains a Concern” (August 2009): “Many structures in Memphis, Tenn., St. Louis, Mo., and other communities in the central Mississippi River Valley region are vulnerable and at risk from severe ground shaking.” The zone “is the most seismically active area of the United States east of the Rockies.” On the odds: “the USGS estimates the chance of having an earthquake similar to one of the 1811–12 sequence in the next 50 years is about 7 to 10 percent, and the chance of having a magnitude 6 or larger earthquake in 50 years is 25 to 40 percent.” The fact sheet adds that roadways in the Mississippi Valley of Arkansas and Missouri, “such as Interstate 55,” could become impassable.
3. Still active: one year in the USGS earthquake catalog
A query of the USGS earthquake catalog (ComCat, FDSN event service) for 2025, in a box from 35.5°N to 37.5°N and 88.5°W to 90.5°W around the seismic zone, returned 232 earthquakes of magnitude 1.0 or larger, of which 13 were magnitude 2.5 or larger. The largest was magnitude 3.07 on September 6, 2025, located “4 km S of Puxico, Missouri.” Almost all were too small to feel. They matter here for a different reason: every one was detected and located by seismometers already operating in the region. The sensors exist; what Missouri does not have is a public system that turns the first seconds of a large earthquake into an alert.
4. ShakeAlert: how a working system does it, on the West Coast
USGS Fact Sheet 2014–3083, version 1.2 (February 2017), is titled “ShakeAlert—An Earthquake Early Warning System for the United States West Coast,” and says the system “is designed to cover the West Coast States of California, Oregon, and Washington.” Why it is possible: “Early warning is possible because information can be sent through communication systems virtually instantaneously, whereas seismic waves travel through the shallow Earth at speeds ranging from 0.5 to 3 miles per second.” The waves: “The faster but weaker P waves trip nearby sensors, causing alert signals to be sent out, giving people and automated electronic systems some time (seconds to minutes) to take protective actions before the arrival of the slower but stronger S waves and surface waves.” The fact sheet’s diagram labels the network “Sensors positioned about 6-12 miles apart.”
“The P wave, which travels fastest, trips sensors placed in the landscape, transmitting data to a ShakeAlert® processing center where the location, size, and estimated shaking of the earthquake are determined. If the earthquake fits the right profile a ShakeAlert® message is issued by the USGS. The message is picked up by ShakeAlert® partners which could be used to produce an alert to notify people to take a protective action such as Drop, Cover, and Hold On …” (USGS image description, “ShakeAlert Earthquake Early Warning Basics”)
This is the chain your diagram must show: P wave → sensors → data to a processing center → location, size and expected shaking computed → USGS issues a message → partners turn it into alerts on phones and into automated actions. USGS news release, May 4, 2021: public alerting “began with California in 2019 and expanded to Oregon in March 2021,” and reached Washington that day, making ShakeAlert “available to more than 50 million people in California, Oregon and Washington”; the same release puts the number of people in the United States at risk of potentially damaging shaking at more than 143 million. Alerts reach phones through “FEMA’s Wireless Emergency Alert system, third-party phone apps, and other technologies.”
What seconds buy. The 2014 fact sheet lists human responses, “Public–Citizens, including schoolchildren, Drop, Cover, and Hold On; turn off stoves; safely stop vehicles,” and automated ones, “Transportation–Automatically slow or stop trains to prevent derailment” and “Businesses–Open elevator doors, shut down production lines, secure chemicals.”
5. The warning channels that already reach Missouri
Wireless Emergency Alerts. National Weather Service: “Wireless Emergency Alerts (WEA) are emergency messages sent by authorized government alerting authorities through your mobile carrier.” “No signup is required! Alerts are sent automatically to WEA-capable phones during an emergency.” Messages are “up to 360 characters on 4G LTE networks and beyond,” and the NWS sends them for warnings including tornadoes. A Missouri phone that buzzes for a tornado warning is using the same delivery channel the West Coast uses for ShakeAlert.
NOAA Weather Radio All Hazards. “A nationwide network of radio stations broadcasting continuous weather information directly from the nearest National Weather Service office,” which also broadcasts warnings for “natural (such as earthquakes or avalanches)” hazards. It has “more than 1000 transmitters, covering all 50 states,” on seven frequencies from 162.400 to 162.550 MHz, and reception “typically extends in about a 40 mile radius from the transmitter.” The NWS list of event codes includes “Earthquake Warning” (code EQW) as operational. Outdoor warning sirens, run by cities and counties, are the third channel; they carry no text, only a sound that means “go find out.”
6. Figures you may cite, with their sources
| Figure | Value | Source |
|---|---|---|
| Magnitudes of the three principal 1811–1812 shocks | M7.5 (Dec. 16, 1811), M7.3 (Jan. 23, 1812), M7.5 (Feb. 7, 1812) | USGS summary, Oct. 2, 2019 |
| Area of damaging shaking; area where felt | 600,000 km²; 5,000,000 km² | USGS summary |
| Chance in 50 years of a repeat of an 1811–1812 earthquake; of M6 or larger | 7 to 10 percent; 25 to 40 percent | USGS FS 2009–3071 |
| Earthquakes in the zone in 2025, M1.0+ and M2.5+ | 232 and 13 (largest M3.07, near Puxico, Mo.) | USGS ComCat query, retrieved Nov. 5, 2026 |
| Speed of shaking waves in the shallow Earth | “0.5 to 3 miles per second” (about 0.8 to 4.8 km/s) | USGS FS 2014–3083 |
| ShakeAlert coverage | California (2019), Oregon (March 2021), Washington (May 4, 2021); more than 50 million people | USGS news release, May 4, 2021 |
| WEA message length | up to 360 characters on 4G LTE and later | NWS WEA page |
| NOAA Weather Radio | more than 1000 transmitters; 162.400–162.550 MHz; about a 40-mile reception radius | NWS NOAA Weather Radio pages |
Not in these sources, and therefore not citable from them: any date when earthquake early warning might come to Missouri, the magnitude threshold for a public alert, the number of sensors in the network, and the typical delivery time to a phone. If you find such a figure on another USGS or NWS page, cite that page and the date you read it, because these systems change.
Your turn
- Write a four-sentence summary of how ShakeAlert works using only section 4, then mark each sentence with the quotation it rests on.
- Using sections 1 to 3, write two sentences explaining why an earthquake early-warning system would be useful in Missouri even though large New Madrid earthquakes are rare.
- Section 5 lists three channels. For each, name the kind of wave that carries the message the last part of the way to a person (radio wave, sound wave or light from a screen).
Sources: USGS, Summary of 1811-1812 New Madrid Earthquakes Sequence (usgs.gov); USGS Fact Sheet 2009-3071, Earthquake Hazard in the New Madrid Seismic Zone Remains a Concern (pubs.usgs.gov); USGS earthquake catalog (FDSN event service) count, 2025, M1.0+, New Madrid region box (earthquake.usgs.gov); USGS Fact Sheet 2014-3083, ShakeAlert: An Earthquake Early Warning System for the United States West Coast (pubs.usgs.gov); USGS, ShakeAlert Earthquake Early Warning Basics (image description) (usgs.gov); USGS news release, Entire U.S. West Coast Now Has Access to ShakeAlert Earthquake Early Warning (May 4, 2021) (usgs.gov); National Weather Service, Wireless Emergency Alerts (weather.gov); National Weather Service, NOAA Weather Radio All Hazards (weather.gov); National Weather Service, NWR Specific Area Message Encoding (SAME) (weather.gov); National Weather Service, NWR event codes (weather.gov)