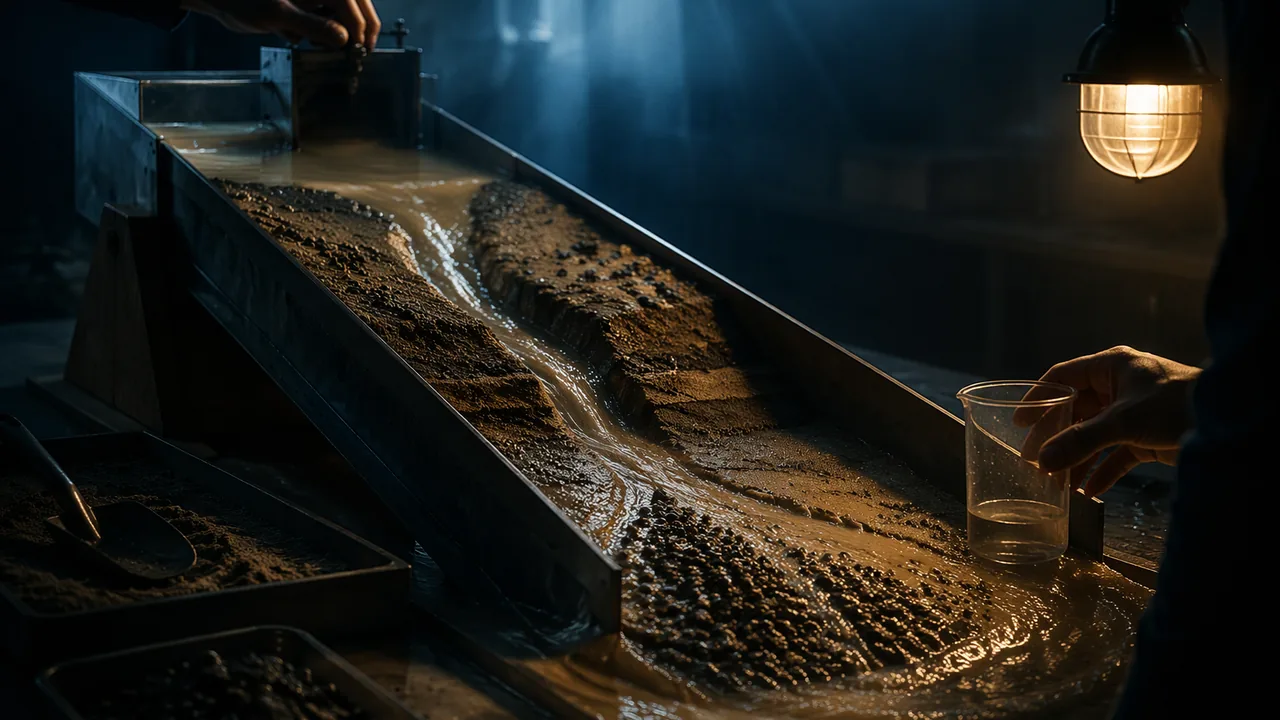
plan and carry out a controlled stream-table investigation of how slope and discharge affect erosion and deposition, and explain the results with the energy of flowing water.
Instruction
The most important sculptor. Running water moves more sediment across Missouri’s land surface than wind, ice or anything else, and in the Ozarks it also works underground, dissolving rock on the way to the springs. Every gravel bar on the Current River was once carried there by the river. To investigate rivers, geologists measure how much water flows, how fast, and what it can carry.
Discharge. A stream’s discharge Q is the volume of water passing a point each second: Q = cross-sectional area × average velocity. Worked example. A channel 20 m wide and 1.5 m deep with water moving 1.2 m/s has Q = 20 × 1.5 × 1.2 = 36 m3/s. If each liter carries 500 mg of suspended sediment, the river carries 36,000 L/s × 0.5 g/L = 18 kg every second, or about 1,555 metric tons per day. Floods raise both the discharge and the sediment concentration, so most sediment moves in a few big storms each year.
Erosion, transport, deposition. Flowing water has kinetic energy, and its speed controls what it can do. Faster water erodes and carries larger grains; when water slows, it drops the largest grains first. Sand grains about 0.5 mm across are the easiest to pick up. Clay is smaller but harder to erode, because the tiny flat particles stick together; once lifted, though, clay stays suspended even in slow water. That is why muddy water stays muddy long after the current slows. Water slows where a stream enters a lake or the sea (building a delta), where a steep stream leaves a narrow valley and spreads onto flat ground (building an alluvial fan: large ones line desert mountain fronts in the American West, and small gravel fans form where steep Ozark hollows meet a wide valley floor), and on the inside of every bend, where Ozark rivers pile up their gravel bars.
Slope and energy. Steeper streams flow faster, so they cut down into their beds and carry coarse gravel; gentle lowland rivers such as the Mississippi below Cape Girardeau meander and deposit sand and mud. In the lab you will change slope by raising one end of the tray. A rise of 5 cm over 100 cm is a 5% slope, about 2.9°.
Planning a fair test. A good investigation changes one independent variable (slope), measures a dependent variable (mass or volume of sediment moved, or the depth of the channel cut), and keeps everything else controlled: the same sand, the same starting shape, the same water flow and the same run time. Repeat each condition at least twice. Decide before you start how you will measure: collecting and weighing the sand that reaches the bottom of the tray, or measuring the channel’s depth at marked points with a ruler. Write the plan first; then run it.
Why it matters. Dams trap the sediment that rivers would otherwise carry downstream. The U.S. Geological Survey found that the closing of Fort Randall Dam on the upper Missouri River in 1952 was the single largest event in the recorded decline of suspended sediment in the whole Mississippi River basin. Less sediment reaching the lower rivers changes their channels and starves the Mississippi delta of the mud that builds land. Understanding sediment transport is how engineers predict what a dam, a dam removal or a flood-control channel will do downstream.
📖 Read for this lesson
The reading opens over the lesson; close it to come back to exactly where you were. The checks below draw on it.
Lab: Stream Table: Slope, Erosion and Deposition
Question. How does the slope of a stream affect how much sediment it erodes and where it deposits it?
Materials
- A paint-roller tray or plastic storage box about 60-100 cm long (the stream table)
- Clean play sand, about 3 L, lightly moistened
- A 2 L plastic bottle with a small hole in the cap, or a cup with a hole, for steady water flow
- Wooden blocks or books to raise one end (2, 5 and 10 cm)
- A bucket or tub to catch runoff, and a kitchen strainer or coffee filter
- Ruler, stopwatch and a kitchen balance
- Wear safety glasses: wet sand can splash into eyes.
- Work outdoors, in a bathtub or over a tray; wipe up spilled water and sand at once so no one slips, keep water away from electrical outlets, and do not pour sand down a drain.
Procedure
- Write your plan: the independent variable (slope), the dependent variable, at least three controlled variables and how many trials you will run. Check it against this list before you start: exactly one variable changed, one variable measured, at least three variables held the same in every run, and at least two trials per slope.
- Pack moist sand into the upper two-thirds of the tray in an even layer 3 cm deep, leaving the lower end empty as a ‘lake’. Mark three points along the center line.
- Raise the upper end by 2 cm. Let 2 L of water flow from the bottle at the top for exactly 60 seconds (or until empty). Observe where the channel forms, where it bends and where sand is deposited.
- Measure the channel depth at the three marked points. Collect the sand deposited in the ‘lake’, drain it in the strainer, and weigh it wet (the same draining time each trial).
- Rebuild the sand bed to the same shape and repeat at 5 cm and 10 cm. Run each slope twice.
Data
| Raise (cm) | Slope (%) | Trial | Channel depth at points 1-3 (mm) | Mass of sand deposited in the lake (g) | Observations (bends, fan, delta) |
|---|---|---|---|---|---|
| 2 | 1 | ||||
| 2 | 2 | ||||
| 5 | 1 | ||||
| 5 | 2 | ||||
| 10 | 1 | ||||
| 10 | 2 |
Illustrative stream-table results (Option B). An 80 cm tray, 2 L of water over 60 seconds in every run, sand drained for the same time before weighing. Constructed teaching numbers, not real measurements; work the slope column out yourself from the raise and the tray length.
| Raise (cm) | Trial | Channel depth at points 1, 2, 3 (mm) | Sand deposited in the lake (g) | Observations |
|---|---|---|---|---|
| 2 | 1 | 4, 5, 3 | 34 | One shallow, winding channel; a low fan at the shoreline |
| 2 | 2 | 5, 4, 4 | 38 | Channel wandered, water pooled midway |
| 5 | 1 | 9, 11, 8 | 96 | Straighter, deeper channel; clear delta built into the lake |
| 5 | 2 | 10, 10, 9 | 88 | Same channel reused; bank collapsed once |
| 10 | 1 | 17, 19, 15 | 205 | Deep straight gully cut to the tray bottom; large delta, water still muddy at the end |
| 10 | 2 | 18, 20, 16 | 221 | Gully widened by slumping; coarse sand dropped first at the lake edge |
Analysis
- Claim: how does slope affect erosion and deposition? Graph mass deposited against slope, and use the graph and channel depths as evidence. Explain the result using the speed and energy of the water.
- Where did the water drop most of its sand, and what real landform does that deposit model (delta or alluvial fan)? Why does the water deposit sand there?
- Compare your two trials at each slope. How consistent were they, and what does that say about the reliability of your conclusion?
- Sources of error: how might uneven packing, weighing wet sand, and changes in the flow rate as the bottle empties affect the results? Propose one improvement to the procedure.
If you cannot do this lab in person: Choose one. All three earn full credit and end in the same graph of sediment moved against slope (or against discharge, for Option C), the same landform explanation and the same four analysis answers. Option A — run your own stream table. The procedure above. A baking tray or a cut-open plastic bottle crate, play sand or garden soil, and a bottle with a hole in the cap are enough; do it outdoors or in a bathtub. If you have no scale, measure channel depth at three marked points instead of weighing the sand, and say in your write-up which dependent variable you used. Option B — the illustrative results in the data section above. No materials and no internet. Compute the slope for each raise, graph mean sand deposited against slope, compare the two trials at each slope, and answer every analysis question from the table and the observations column. Option C — the public record of a real Missouri river. Use this lesson’s hosted reading, the USGS gage on the Current River at Van Buren (station 07067000), instead of a live query. Take the highest daily mean of water year 2026 (9,330 ft³/s, March 8, 2026) and the lowest (745 ft³/s, September 30, 2026), convert both to m³/s, compute the ratio, and use the discharge equation from this lesson to explain what that ratio means for the sediment the river can carry. Then compare it with the reading’s record for Big Spring, which feeds the same river, and explain why a spring-fed river changes so much less than a river fed mostly by runoff. Your independent variable is the season rather than the slope, so say clearly how that changes what you can conclude, and answer the landform and sources-of-error questions about the real river. Cite the station number and the retrieval date in the reading.
Formative check
Work through these before moving on. They are not graded — they tell you whether the standard below has landed yet.
A stream is 8 m wide and 0.5 m deep and flows at 0.75 m/s. What is its discharge?
A steep Ozark creek carrying gravel, sand and mud flows out of its narrow hollow onto the wide, flat floodplain of the Current River. Which sediment is dropped closest to the mouth of the hollow?
Clay particles are the easiest sediment for flowing water to pick up, because they are the smallest.
Write your investigation plan: your question, independent and dependent variables, at least three controlled variables, the number of trials, and exactly how you will measure erosion. Then predict your result and give a reason based on the energy of flowing water.
How confident are you that you can plan and conduct an investigation of how running water erodes and deposits sediment?
Practice
Work these on paper or in your notebook, then open Check your answer. Aim for all of Fluency and Application; try at least one Challenge.
Printable version: this unit’s practice workbook (PDF)
Fluency
Build speed and accuracy with the core skill.
- A stream is 20 m wide, 1.5 m deep and flows at 1.2 m/s. What is its discharge?
Check your answer
Answer: 36 m3/sQ = width × depth × velocity. - A stream table is raised 5 cm over a 100 cm length. What is its slope as a percentage and as an angle?
Check your answer
Answer: 5%; about 2.9°tan−1(5/100). - A creek is 4 m wide, 0.5 m deep and flows at 0.6 m/s. Find the discharge.
Check your answer
Answer: 1.2 m3/s
Application
Use the skill in context. Show your reasoning.
- A river with discharge 36 m3/s carries 500 mg of suspended sediment per liter. How much sediment does it carry per second and per day?
Check your answer
Answer: 18 kg/s; about 1,555 metric tons per day36,000 L/s × 0.5 g/L = 18,000 g/s. - In a flood, the same river’s discharge rises to 400 m3/s and sediment concentration to 5,000 mg/L. How many times more sediment per second does it carry than at 36 m3/s and 500 mg/L?
Check your answer
Answer: about 111 times(400 × 5,000) / (36 × 500). - In your stream table, name the independent variable, the dependent variable and three controlled variables.
Check your answer
Answer: Independent: slope. Dependent: mass of sand deposited (or channel depth). Controlled: same sand and packing, same volume and rate of water, same run time. - On the Current River at Van Buren (USGS 07067000), the highest daily mean flow in water year 2026 was 9,330 ft3/s and the lowest 745 ft3/s. Convert both to m3/s (1 ft3 = 0.02832 m3) and find the ratio. Why is the ratio small for a river this size?
Check your answer
Answer: about 264 m3/s and 21.1 m3/s; ratio about 12.5; large springs such as Big Spring feed the river steadily from groundwater between storms9,330 × 0.02832; 745 × 0.02832; 9,330 / 745.
Challenge
Stretch problems. Expect to think before you write.
- Explain, using energy, why a steep Ozark creek leaving its narrow hollow onto a wide, flat valley floor drops coarse gravel near the mouth of the hollow and carries finer sand and mud farther.
Check your answer
Answer: The water spreads out and slows, losing kinetic energy; it drops the largest grains first, and finer sand and mud are carried farther before they settle, so the deposit fines outward like an alluvial fan.
Review
Keep earlier skills sharp.
- Compare a magnitude 6.5 earthquake with a magnitude 5.0 earthquake. About how many times larger is the ground-motion amplitude, and about how many times more energy is released?
Check your answer
Answer: amplitude ≈ 31.6 times; energy ≈ 178 timesEach whole step in magnitude is 10 times the amplitude and about 32 times (101.5) the energy. - Review (Unit 3): an S-P lag of 9.0 s means the earthquake is how far away (d = 8.4 × lag)?
Check your answer
Answer: 75.6 km
The Current River and Big Spring, Water Year 2026: A Real Missouri Discharge Record for the Stream-Table Lab
USGS NWIS daily values, station 07067000 Current River at Van Buren, MO and station 07067500 Big Spring near Van Buren, MO, parameter 00060 (discharge, ft3/s), 2025-10-01 to 2026-09-30 (365 days; provisional from 2026-08-18); USGS SIR 2011-5200; NPS Ozark National Scenic Riverways springs page; retrieved November 6, 2026 · Public domain (works of the United States government), with SLS original worked computations
Why this reading. Option C of the stream-table lab uses the public record of a real river, and a record fetched live can be down on the day you need it. Here is a dated snapshot of the Current River at Van Buren and of Big Spring, which joins the river a few miles downstream, from the U.S. Geological Survey’s gages, for the water year that ended September 30, 2026. The lesson’s Option B table is also worked below, so that the graph of sediment against slope can be drawn from the page.
Table 1. Daily mean discharge by month, water year 2026
USGS station 07067000, Current River at Van Buren, Missouri, and USGS station 07067500, Big Spring near Van Buren, Missouri. A water year runs October 1 to September 30. Values are daily means in cubic feet per second (ft3/s); the USGS marks values from mid-August 2026 on as provisional until reviewed. Retrieved November 6, 2026.
| Month | Current River at Van Buren (ft3/s) | Big Spring (ft3/s) | ||||
|---|---|---|---|---|---|---|
| Mean | Highest day | Lowest day | Mean | Highest day | Lowest day | |
| October 2025 | 1,104 | 1,220 | 1,060 | 391 | 421 | 372 |
| November 2025 | 1,286 | 2,340 | 1,040 | 358 | 395 | 347 |
| December 2025 | 1,106 | 1,320 | 992 | 333 | 348 | 324 |
| January 2026 | 970 | 1,010 | 940 | 327 | 330 | 325 |
| February 2026 | 1,223 | 2,610 | 930 | 342 | 407 | 329 |
| March 2026 | 2,727 | 9,330 | 1,060 | 478 | 734 | 336 |
| April 2026 | 2,308 | 6,410 | 1,140 | 397 | 530 | 363 |
| May 2026 | 1,542 | 3,550 | 1,090 | 404 | 512 | 365 |
| June 2026 | 1,455 | 2,830 | 1,080 | 370 | 430 | 354 |
| July 2026 | 1,017 | 1,480 | 864 | 340 | 357 | 308 |
| August 2026 | 950 | 1,880 | 786 | 307 | 327 | 291 |
| September 2026 | 763 | 784 | 745 | 303 | 321 | 291 |
The extremes. Current River: highest daily mean 9,330 ft3/s on March 8, 2026, after heavy rain; lowest 745 ft3/s on September 30, 2026. One cubic foot is 0.028317 m3, so these are 264.2 m3/s and 21.1 m3/s. The ratio is 9,330 / 745 = 12.5. Big Spring peaked the same day at 734 ft3/s (a value the USGS marks as estimated) and fell to 291 ft3/s on August 14 and again on September 30: a ratio of only 2.52. The year’s mean flows were 1,371 ft3/s for the river and 363 ft3/s (10.3 m3/s) for Big Spring. The National Park Service gives Big Spring’s long-term average as about 289 million gallons a day, about 447 ft3/s, so 2026 was a below-average year for the spring.
What the ratio means
Discharge is Q = area × velocity, so a 12.5-fold change in Q comes partly from a deeper, wider channel and partly from faster water. Since the grain size flowing water can move rises with its speed, most of the year’s gravel moves in the few days of high water, such as the March storm. Even so, the Current River never drops very low: large springs, including those along the Current and Jacks Fork upstream of Van Buren, feed it steadily from groundwater stored in the dissolved-out dolomite. A river fed mostly by runoff from the land surface can carry hundreds of times more water on its biggest day than on its smallest. If you use this record for Option C, your independent variable is the season, not the slope, so you can conclude how discharge controls transport but not how slope does; say so.
The worked discharge, checked. A channel 20 m wide and 1.5 m deep at 1.2 m/s: Q = 20 × 1.5 × 1.2 = 36 m3/s. At 500 mg/L of suspended sediment, 36,000 L/s × 0.5 g/L = 18,000 g/s = 18 kg/s; over a day, 18 × 86,400 = 1,555,200 kg = 1,555 metric tons. The quiz stream: 8 × 0.5 × 0.75 = 3.0 m3/s.
Table 2. The lesson’s Option B stream-table results, worked
Tray 80 cm long; slope = raise / length. Illustrative constructed data, as labeled in the lesson.
| Raise (cm) | Slope (%) | Slope (degrees) | Sand deposited, trial 1 (g) | Trial 2 (g) | Mean (g) | Difference between trials | Mean channel depth (mm) |
|---|---|---|---|---|---|---|---|
| 2 | 2.5 | 1.4 | 34 | 38 | 36 | 4 (11% of the mean) | 4.2 |
| 5 | 6.25 | 3.6 | 96 | 88 | 92 | 8 (9% of the mean) | 9.5 |
| 10 | 12.5 | 7.1 | 205 | 221 | 213 | 16 (8% of the mean) | 17.5 |
Slope in degrees is tan−1(raise / 80). Doubling the slope from 6.25% to 12.5% more than doubled the sand moved (92 to 213 g), and the two trials at each slope differ by about a tenth of their mean, so the trend is far larger than the scatter: the conclusion is reliable at these three slopes, and no more than that. The deposit at the tray’s lower end, where the current spread into standing water and slowed, models a delta; where a steep channel opens onto a flat floor without standing water, the same slowing builds an alluvial fan.
Dams and sediment (USGS)
Heimann, Sprague and Blevins (USGS, 2011) analyzed suspended sediment in the Mississippi River basin from 1950 to 2009: loads generally went down; the Missouri River has historically carried the largest annual suspended-sediment load of the major subbasins; and “the closure of Fort Randall Dam in the upper Missouri River in 1952 was the single largest event in the recorded historical decline.” Below the dams, scour of the main channel is likely the largest source of suspended sand in the lower Missouri River: the river, deprived of sediment from upstream, takes it from its own bed.
Reading the gage
The USGS does not measure discharge directly every day. It measures the water level (gage height) continuously and converts it with a rating curve built from many direct measurements of width, depth and velocity across the channel, the same Q = area × velocity you use. That is why recent values are “provisional” and a few are “estimated”: the rating is rechecked, and values can be revised. When you cite this record, give the station number, the parameter (00060, discharge) and the retrieval date as the source line above does.
Sources: USGS monitoring location 07067000, Current River at Van Buren, MO (waterdata.usgs.gov); USGS monitoring location 07067500, Big Spring near Van Buren, MO (waterdata.usgs.gov); USGS NWIS daily values web service (query used for Table 1) (waterservices.usgs.gov); Heimann, Sprague and Blevins 2011, Trends in suspended-sediment loads and concentrations in the Mississippi River Basin, 1950-2009 (USGS SIR 2011-5200) (pubs.usgs.gov); NPS Ozark National Scenic Riverways, Springs and Seeps (nps.gov)