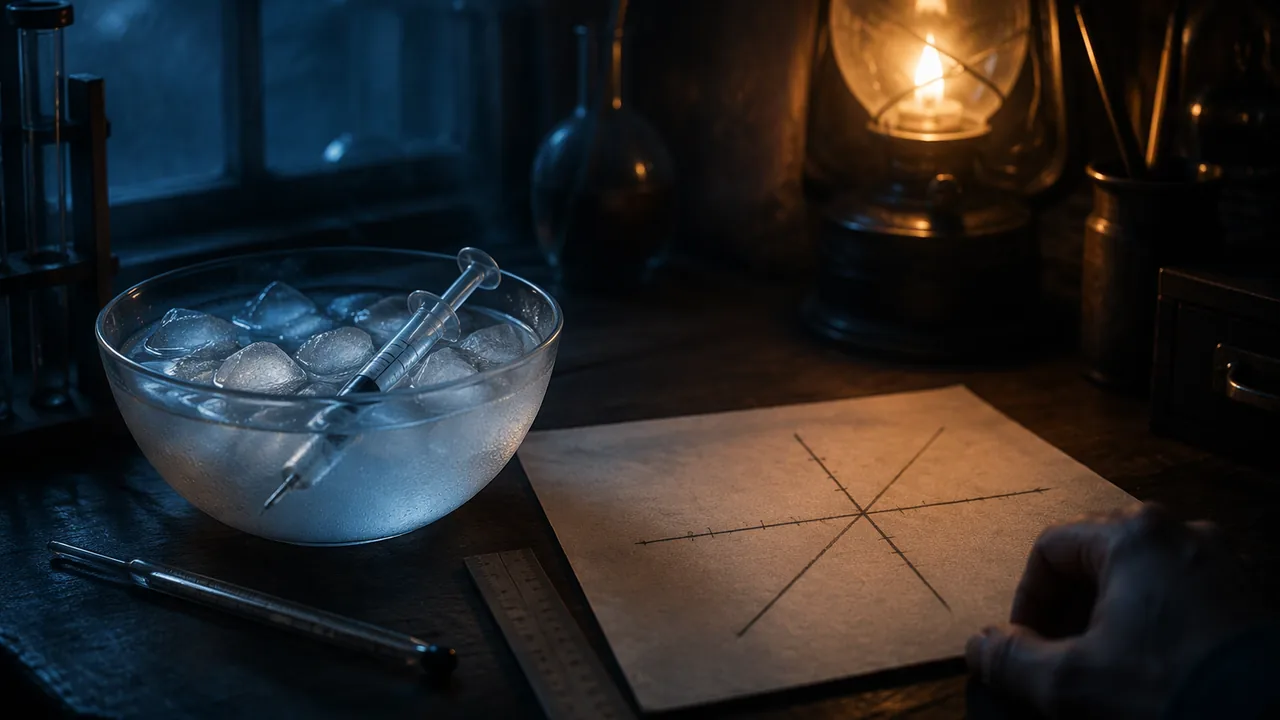
plan and carry out an investigation of how the volume of a trapped gas changes with temperature, graph the data and extrapolate the line to estimate absolute zero.
Instruction
The question. If a trapped gas shrinks steadily as it cools, how far could you cool it? Charles’s law says the volume of a gas at constant pressure is proportional to its kelvin temperature. If that is true, then a graph of volume against Celsius temperature is a straight line, and extending that line down to zero volume should land at the temperature where the particles would have no motion to give: absolute zero. You will test this with a sealed plastic syringe and three water baths, none hotter than room temperature.
The setup. A syringe of air sealed at the tip is a small gas sample whose pressure stays near outside air pressure, because the plunger slides freely. Draw the plunger to 50.0 mL while the syringe sits in room-temperature water at about 21 °C, seal the tip, and read the volume. Then move the syringe, with the barrel under water, into cool tap water at about 12 °C and into ice water at about 1 °C. Wait two minutes each time for the air to reach the water temperature, give the plunger a gentle twist to overcome friction, and read the volume at the bottom of the black plunger seal. Measure each water temperature with a thermometer right before you read, not before you pour.
What the model predicts. Starting at 50.0 mL and 294.15 K (21 °C), the ideal prediction at 1 °C (274.15 K) is 50.0 × 274.15 ÷ 294.15 = 46.6 mL, a shrink of 3.4 mL for a 20 °C drop. The slope is about (50.0 − 46.6) ÷ 20.0 = 0.17 mL per °C. Extend the line to zero volume: 21.0 − 50.0 ÷ 0.170 = −273.1 °C. Your line will not be perfect, but it should point to a number a few hundred degrees below zero, and that is a remarkable thing to get from a kitchen experiment.
Graphing and the trend line. Put temperature in °C on the x-axis and volume on the y-axis. Start the x-axis far enough to the left (to −300 °C) that you can extend your line. Draw one straight line through the middle of your points rather than connecting them. Read where it crosses zero volume. A spreadsheet’s linear fit gives a slope and an intercept: set V = m × T + b, then the temperature at zero volume is −b ÷ m.
Uncertainty. Reading a syringe to the nearest 0.5 mL means a reading of 46.5 mL could really be anywhere from 46.25 to 46.75 mL, a 1.1% uncertainty. Because you extrapolate over about 294 degrees using data spread across about 20, a small error in the slope moves the answer a lot. A friction-stuck plunger, a temperature that has not equalized, and warm fingers on the barrel all push your data the same way. The point of the analysis is to say how close you came, what the extrapolation assumes, and why it can never be confirmed directly: real gases liquefy before they reach absolute zero, so the line is a prediction of the model, not an observation.
Safety and the recorded-data path. Use a plastic syringe with no needle, and never heat the syringe or any container. Ice water and room-temperature water only. If you have no syringe or thermometer, use the six recorded runs in this lesson’s reading and do the same graph and analysis; the goal of the lesson is the same either way.
📖 Read for this lesson
The reading opens over the lesson; close it to come back to exactly where you were. The checks below draw on it.
Lab: Gas Volume and Temperature: Estimating Absolute Zero
Question. How does the volume of a fixed amount of air change as its temperature changes, and what temperature does the trend predict for zero volume?
Materials
- A 60 mL plastic syringe with no needle (from a pharmacy or craft store) and a small rubber cap or stopper that seals the tip
- Three wide containers or bowls deep enough to cover the syringe barrel: ice water (ice removed), cool tap water, and room-temperature water
- A kitchen or digital thermometer, a ruler or the syringe’s own scale, a clock or timer
- Graph paper or a spreadsheet, paper towels
- Tell a parent or guardian before you start. Use a plastic syringe without a needle only.
- Use ice water, cool tap water and room-temperature water only: no kettles, stoves, microwaves or hot water, and no glass containers.
- Do not put the syringe or the water in your mouth, and wipe up spills so no one slips.
Procedure
- Put the syringe in the room-temperature bath, draw the plunger to 50.0 mL, press the cap onto the tip, and wait two minutes. Record the water temperature and the volume.
- Move the sealed syringe into the cool tap water bath, wait two minutes, twist the plunger gently, and record the water temperature and the volume. Do not let the volume drift while you read it.
- Move the sealed syringe into the ice-water bath, wait two minutes, twist the plunger gently, and record the temperature and the volume.
- Repeat steps 1-3 once so you have two trials for each bath. Always restart from 50.0 mL at room temperature.
- Graph volume (y) against temperature in °C (x) with the x-axis running from −300 °C to 30 °C. Draw one straight best-fit line through your data and extend it to zero volume. Record the temperature where it crosses.
- Compare your data and your estimate of absolute zero with the six recorded runs in this lesson’s reading.
Data
| Bath | Trial | Temperature (°C) | Temperature (K) | Volume (mL) | Volume ÷ temperature (mL/K) |
|---|---|---|---|---|---|
| Room | 1 | ||||
| Room | 2 | ||||
| Cool tap | 1 | ||||
| Cool tap | 2 | ||||
| Ice water | 1 | ||||
| Ice water | 2 |
Analysis
- Claim: how does volume change with temperature? Evidence: your table and graph. Reasoning: explain it with the speed and wall collisions of gas particles, and say what stayed constant (amount and pressure).
- Calculate volume ÷ kelvin temperature for every run. If Charles’s law holds, these numbers should be nearly equal. How close are they, and what is the largest difference?
- State your estimate of absolute zero in °C and the percent error compared with −273.15 °C. Name two likely causes of the error and say which way each would move your estimate.
- Explain why your line cannot be tested all the way to zero volume, and why the estimate is still evidence for the model.
- Compare your result with the six recorded runs in this lesson’s reading. Are they consistent with yours?
If you cannot do this lab in person: No syringe or thermometer? Use the six recorded runs in the data table of this lesson’s reading: graph volume against temperature, draw the best-fit line, extend it to zero volume, calculate volume ÷ kelvin for each run, and write the same claim-evidence-reasoning analysis. The reading gives the fitted slope and intercept so you can check your graph.
Formative check
Work through these before moving on. They are not graded — they tell you whether the standard below has landed yet.
A sealed syringe of air at 21 °C is placed in ice water. The volume of the air will
Starting at 50.0 mL and 294.15 K (21 °C), the ideal volume at 12 °C (285.15 K) is
It is fine to read the syringe volume right after moving it to a new bath, as long as you read it carefully.
Use the data table in this lesson’s reading. The best-fit line through the six recorded runs reaches zero volume at about − °C (nearest whole number).
Write your claim-evidence-reasoning paragraph. Include your two volumes at the coldest and the warmest bath, your estimate of absolute zero with its percent error, and a particle-level explanation of why the volume falls as the temperature falls.
How confident are you that you can plan a fair gas-volume investigation, graph the data and extrapolate to absolute zero?
Practice
Work these on paper or in your notebook, then open Check your answer. Aim for all of Fluency and Application; try at least one Challenge.
Printable version: this unit’s practice workbook (PDF)
Fluency
Build speed and accuracy with the core skill.
- A sealed syringe holds 46.6 mL at 1.0 °C. At constant pressure, what is its volume at 21 °C?
Check your answer
Answer: 50.0 mLV2 = 46.6 × 294.15 ÷ 274.15 = 50.0 mL. - Convert 12 °C to kelvins.
Check your answer
Answer: 285.15 K12 + 273.15 = 285.15. - Why must temperature be in kelvins, not °C, in the equation V1/T1 = V2/T2?
Check your answer
Answer: Volume is proportional to the kelvin temperature, which starts at absolute zero; the Celsius zero is an arbitrary point, so ratios of Celsius numbers do not describe the gas. - A best-fit line has a slope of 0.17 mL per °C and passes through 50.0 mL at 21 °C. Predict the volume at 5 °C.
Check your answer
Answer: 47.3 mL50.0 − 16 × 0.17 = 47.28 mL. - A reading of 46.5 mL has an uncertainty of ±0.5 mL. What is the percent uncertainty?
Check your answer
Answer: About 1.1%0.5 ÷ 46.5 × 100 = 1.075%.
Application
Use the skill in context. Show your reasoning.
- Two of your runs are (11 °C, 48.0 mL) and (22 °C, 50.5 mL). Find the slope and the temperature at which the line reaches zero volume.
Check your answer
Answer: Slope 0.227 mL/°C; zero volume at about −200 °CSlope = (50.5 − 48.0) ÷ (22 − 11) = 0.2273. T = 22 − 50.5 ÷ 0.2273 = −200.2 °C. - A student’s extrapolation gives absolute zero at −246 °C. What is the percent error compared with −273.15 °C?
Check your answer
Answer: About 9.9%(273.15 − 246) ÷ 273.15 × 100 = 9.94%. - How many moles of air are in a 50.0 mL syringe at 101.325 kPa and 294.15 K? (R = 8.314462618 J/(mol·K))
Check your answer
Answer: 0.00207 mol (2.07 × 10⁻³ mol)n = PV ÷ RT = (101,325 × 50.0 × 10−6) ÷ (8.314462618 × 294.15) = 0.002071 mol. - Your plunger sticks, so the gas is at a slightly lower pressure than outside when you read the cold bath. Does your cold-bath volume read too high or too low, and how does that affect your estimate of absolute zero?
Check your answer
Answer: Too high, because the gas is not pulled in fully; the line becomes flatter than the true line, which moves the extrapolated zero to a lower (more negative) temperature than it should be.
Challenge
Stretch problems. Expect to think before you write.
- Starting from 50.0 mL at 21 °C (294.15 K), what is the ideal volume at 0 °C? The fitted line in this lesson’s reading gives 46.14 mL at 0 °C. What is the difference?
Check your answer
Answer: Ideal: 46.43 mL. The fit is 0.29 mL lower.V = 50.0 × 273.15 ÷ 294.15 = 46.43 mL; 46.43 − 46.14 = 0.29 mL. - Predict the ideal volume of the same syringe at 38 °C. Why would you not test it by heating the syringe at home?
Check your answer
Answer: 52.9 mL. Heating plastic or water creates burn and melting hazards; the course rule is cold and room-temperature baths only.V = 50.0 × 311.15 ÷ 294.15 = 52.9 mL.
Review
Keep earlier skills sharp.
- A 50.0 mL sample of gas at 101.3 kPa is compressed to 20.0 mL at constant temperature. Find the new pressure.
Check your answer
Answer: 253 kPaP2 = 101.3 × 50.0 ÷ 20.0 = 253.3 kPa. - Calculate the molar mass of N2 using 14.007 g/mol for nitrogen.
Check your answer
Answer: 28.014 g/mol2 × 14.007 = 28.014.
Six Recorded Syringe Runs and a Fitted Absolute-Zero Estimate
SLS constructed teaching data (illustrative): six syringe readings consistent with an ideal-gas prediction from 50.0 mL at 21 °C, rounded to 0.5 mL with small deviations; ideal-gas values and the linear fit are SLS calculations; R from NIST CODATA 2022, retrieved 2026-11-15 · SLS original (prose and constructed teaching data, labeled illustrative)
Why this reading. If you have no syringe or thermometer, or want to compare your own runs with a full set, this reading gives six recorded runs with the ideal-gas prediction for each, the fitted line and the estimate of absolute zero that line gives.
How the data were produced
These are illustrative readings, not a published measurement. They follow the procedure in the lesson: a 60 mL syringe sealed with 50.0 mL of air at 21 °C, moved to cooler water baths, each reading rounded to the nearest 0.5 mL, with the small scatter a real plunger shows.
Data table
| Run | Bath temperature (°C) | Temperature (K) | Volume read (mL) | Ideal volume (mL) | Read − ideal (mL) | Volume ÷ kelvin (mL/K) |
|---|---|---|---|---|---|---|
| 1 | 1 | 274.15 | 46.5 | 46.60 | -0.10 | 0.1696 |
| 2 | 2 | 275.15 | 46.5 | 46.77 | -0.27 | 0.1690 |
| 3 | 11 | 284.15 | 48.0 | 48.30 | -0.30 | 0.1689 |
| 4 | 13 | 286.15 | 48.5 | 48.64 | -0.14 | 0.1695 |
| 5 | 21 | 294.15 | 50.0 | 50.00 | +0.00 | 0.1700 |
| 6 | 22 | 295.15 | 50.5 | 50.17 | +0.33 | 0.1711 |
Linear fit (volume against Celsius temperature)
Fitting a straight line to the six points gives a slope of 0.1876 mL per °C (or per K) and a volume of 46.14 mL at 0 °C. Setting the volume to zero gives a temperature of about −246 °C (−246.0 °C before rounding). The accepted value of absolute zero is −273.15 °C, so the rounded estimate of −246 °C is off by 9.9 percent.
Reading the table
- Volume ÷ kelvin is nearly constant, between about 0.1689 and 0.1711 mL/K: Charles’s law holds within the 0.5 mL reading uncertainty.
- The data span only 21 °C, but the line is extended about 294 °C to zero volume, so a small change in the slope changes the estimate a lot. An uncertainty of 0.5 mL (about 1.1 percent of 46.5 mL) is large enough to move the estimate by tens of degrees.
- No syringe can be cooled to the temperature where the line reaches zero: real gases condense before that.
Sources: NIST CODATA: molar gas constant (physics.nist.gov)