plan and carry out an investigation comparing how water and sand heat and cool, and use specific heat to explain the difference between Missouri’s continental climate and a coastal climate.
Instruction
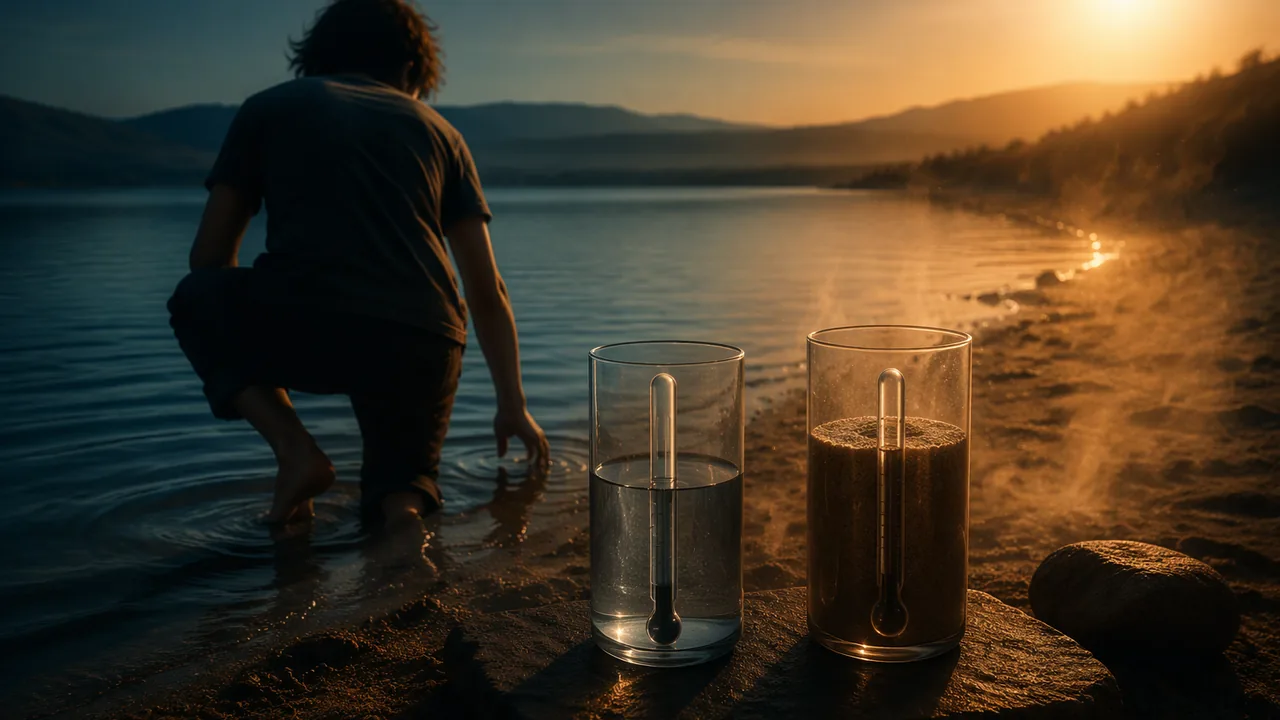
Same sunshine, different temperatures. On a July afternoon at a sandy swimming beach on a Missouri lake, the dry sand can be too hot to walk on barefoot while the water feels cool. Both receive the same sunlight. The difference is a property of the materials: how much energy they need to warm up.
Specific heat. The specific heat of a substance is the energy needed to raise the temperature of 1 kg of it by 1 °C. For liquid water it is about 4,184 J/(kg·°C); for dry quartz sand, about 830 J/(kg·°C). The energy equation is
Q = m × c × ΔT
where Q is energy in joules, m the mass, c the specific heat and ΔT the temperature change.
Worked example. Give 1,000 J to 100 g (0.100 kg) of each. Water: ΔT = 1,000 / (0.100 × 4,184) ≈ 2.4 °C. Sand: ΔT = 1,000 / (0.100 × 830) ≈ 12.0 °C. The sand warms about five times as much from the same energy, and it cools about five times as fast when the energy source is removed.
Why water is so hard to heat. Water’s high specific heat comes from its hydrogen bonds (Earth Science A, Unit 4). Energy added to water first goes into jostling and breaking those bonds before it speeds the molecules up. Other effects make the ocean even harder to heat than a lab cup: sunlight penetrates meters into clear water instead of stopping at the surface; waves and currents mix warmed water downward; and evaporation carries energy away. On land, the energy stays in the top few centimeters of soil.
From the lab to the map. The Pacific next to San Francisco changes temperature only a few degrees over the year. Air that has passed over it arrives with the ocean’s temperature, so that coast has mild summers and mild winters: a small annual range, 8.5 °F in the NOAA normals. St. Louis, at almost the same latitude but more than 900 km from the nearest ocean water and surrounded by land that heats and cools quickly, has a range of 49.2 °F. The ocean can only moderate air that has actually crossed it. Norfolk, Virginia, sits on the Atlantic at almost exactly Springfield’s latitude, but the prevailing westerly winds usually reach it across the continent, so its range is 38.7 °F: smaller than Springfield’s 45.3 °F, nothing like San Francisco’s. The same property explains why coastal nights are rarely frosty and why the hottest temperatures are found in deserts and continental interiors, not on beaches.
Planning your test. To compare water and sand fairly, the samples must have the same mass, sit the same distance from the same lamp, start at the same temperature and use the same kind of container. The independent variable is the material; the dependent variable is temperature over time. You will record both heating (lamp on) and cooling (lamp off), because a mild climate is about both. Before you start, predict the shape of each curve and give a reason from Q = mcΔT.
📖 Read for this lesson
The reading opens over the lesson; close it to come back to exactly where you were. The checks below draw on it.
Lab: Heating and Cooling Water and Sand
Question. Do equal masses of water and dry sand heat and cool at different rates under the same lamp, and by how much?
Materials
- Two identical clear plastic cups
- 200 g of dry sand and 200 g of room-temperature water (measured on a kitchen balance)
- Two kitchen thermometers (digital or alcohol-filled, not mercury)
- A desk lamp with a 60 W-equivalent bulb, or strong direct sunlight
- Ruler, stopwatch and graph paper or a spreadsheet
- Wear safety goggles, because water is used near an electrical lamp; keep the water cup and wet hands away from the lamp’s cord and switch.
- Lamp bulbs and shades get hot: do not touch them, and let the lamp cool before moving it. Stop at once if a cup begins to soften.
Procedure
- Fill one cup with 200 g of sand and the other with 200 g of water, both at room temperature. Insert a thermometer 1 cm below the surface of each.
- Place both cups side by side, 20 cm below the lamp (or in the same patch of sunlight). Record both starting temperatures.
- Switch on the lamp. Record both temperatures every minute for 10 minutes.
- Switch off the lamp (or move the cups into shade) and record every minute for 10 more minutes as they cool.
- Graph temperature against time for both materials on the same axes, and calculate each material’s temperature change during heating and cooling.
Data
| Time (min) | 0 | 2 | 4 | 6 | 8 | 10 (lamp off) | 12 | 14 | 16 | 18 | 20 |
|---|---|---|---|---|---|---|---|---|---|---|---|
| Sand (°C) | |||||||||||
| Water (°C) |
Record every minute; the table shows every second minute to save space.
Analysis
- Claim: which material heats and cools faster? Use your temperature changes as evidence and explain them with specific heat and Q = mcΔT.
- Divide the sand’s temperature rise by the water’s. How does your ratio compare with the ideal ratio of about 5 (4,184 / 830)? Suggest why the real ratio might be smaller.
- Use your results to explain why San Francisco’s annual temperature range is 8.5 °F while St. Louis’s is 49.2 °F.
- Sources of error: how might the thermometer depth, evaporation from the water, and uneven lamp distance affect your results?
If you cannot do this lab in person: Place two identical cups of sand and water in direct sunlight at home and read them with a kitchen thermometer every 5 minutes, or analyze the complete recorded run (two trials, every minute) in this lesson’s reading.
Formative check
Work through these before moving on. They are not graded — they tell you whether the standard below has landed yet.
How much energy raises 0.50 kg of water by 4.0 °C? (c = 4,184 J/(kg·°C))
Two cups, one of water and one of sand, are placed under a lamp for 10 minutes and then in the shade for 10 minutes. Which will be warmer 10 minutes after the lamp is switched off?
Giving the same energy to equal masses of sand and water makes the sand’s temperature rise about five times as much.
Write your investigation plan: the question, independent and dependent variables, at least four controlled variables, and a prediction of the heating and cooling curves with a reason based on specific heat.
How confident are you that you can investigate how water and sand heat and cool and use specific heat to explain coastal and inland climates?
Practice
Work these on paper or in your notebook, then open Check your answer. Aim for all of Fluency and Application; try at least one Challenge.
Printable version: this unit’s practice workbook (PDF)
Fluency
Build speed and accuracy with the core skill.
- How much energy warms 0.200 kg of water by 3.0 °C? (c = 4,184 J/(kg·°C))
Check your answer
Answer: 2,510 JQ = mcΔT. - 2,000 J is added to 0.100 kg of dry sand (c = 830 J/(kg·°C)). What is the temperature rise?
Check your answer
Answer: 24.1 °CΔT = Q / (mc). - 2,000 J is added to 0.100 kg of water. What is the temperature rise?
Check your answer
Answer: 4.8 °C
Application
Use the skill in context. Show your reasoning.
- A lamp delivers 5,000 J to each of 0.200 kg of sand and 0.200 kg of water. Find each temperature rise and their ratio.
Check your answer
Answer: sand 30.1 °C; water 6.0 °C; ratio about 5.0 - In the lab, sand rose 9.0 °C and water 2.5 °C. What ratio did you measure, and why is it smaller than the ideal ratio of about 5?
Check your answer
Answer: 3.6; the sand’s surface heats most while the thermometer reads deeper, heat is lost to the air and cup, and evaporation cools the water - Use specific heat to explain why San Francisco’s annual range (8.5 °F) is so much smaller than St. Louis’s (49.2 °F).
Check your answer
Answer: Air reaching San Francisco has passed over the Pacific, whose high specific heat keeps it at nearly the same temperature all year; St. Louis is surrounded by land that heats and cools quickly, and its air usually arrives across that land.
Challenge
Stretch problems. Expect to think before you write.
- How much energy warms 1 m3 of seawater (1,025 kg, c ≈ 4,006 J/(kg·°C)) by 1 °C, compared with 1 m3 of air (1.2 kg, c = 1,005)? What does the ratio mean for where Earth’s extra heat is stored?
Check your answer
Answer: seawater about 4,106,150 J; air about 1,206 J; about 3,405 times more for water, so the ocean stores most of the extra energy
Review
Keep earlier skills sharp.
- Review (Unit 1): a 200 mL sample of gravel holds 70 mL of water in its pores. What is its porosity?
Check your answer
Answer: 35%
Fifteen Degrees Against Four: A Recorded Heating-and-Cooling Run, and Why St. Louis Swings While the Pacific Coast Does Not
SLS illustrative lab record (200 g sand and water under a 60 W-equivalent lamp, two runs); NOAA NCEI U.S. Climate Normals 1991-2020, stations USW00023272, USW00013994, USW00024213, USW00014938, USW00013737, USW00013995; Engineering ToolBox, Specific Heat of Common Substances (sand, quartz; water, pure liquid); all retrieved November 6, 2026 · SLS original, with NOAA public-domain figures and published reference values cited as facts
Why this reading. The lab can be run at home, but not everyone has a lamp, two thermometers and a kitchen scale on the same afternoon. Here is a complete recorded run of the procedure, two trials, every minute, so that the heating and cooling curves, the temperature-change ratio and the error discussion can all be done from the page. It is SLS teaching data, constructed to behave the way a 60 W-equivalent lamp and two plastic cups behave, and labeled illustrative. The specific heats are published reference values and the climate numbers at the foot are NOAA’s, both retrieved November 6, 2026.
Table 1. Recorded run (SLS illustrative data)
Two identical 250 mL clear cups; 200 g dry play sand and 200 g tap water weighed on a kitchen balance; digital thermometers with the probe 1 cm below each surface; cups side by side 20 cm below a 60 W-equivalent (800 lumen) LED desk lamp; room at 21 °C; lamp on at minute 0 and off at minute 10. Two runs on the same afternoon with fresh sand and water. Constructed teaching numbers, not measurements.
| Minute | 0 | 1 | 2 | 3 | 4 | 5 | 6 | 7 | 8 | 9 | 10 | 11 | 12 | 13 | 14 | 15 | 16 | 17 | 18 | 19 | 20 |
|---|---|---|---|---|---|---|---|---|---|---|---|---|---|---|---|---|---|---|---|---|---|
| Run 1, sand (°C) | 21.0 | 23.1 | 25.3 | 27.4 | 29.3 | 31.0 | 32.5 | 33.8 | 34.9 | 35.8 | 36.5 | 34.6 | 32.9 | 31.4 | 30.1 | 29.0 | 28.0 | 27.1 | 26.4 | 25.8 | 25.3 |
| Run 1, water (°C) | 21.0 | 21.4 | 21.9 | 22.3 | 22.8 | 23.2 | 23.6 | 24.0 | 24.4 | 24.7 | 25.0 | 24.9 | 24.8 | 24.7 | 24.6 | 24.5 | 24.4 | 24.3 | 24.2 | 24.1 | 24.0 |
| Run 2, sand (°C) | 20.8 | 22.7 | 24.8 | 26.8 | 28.6 | 30.2 | 31.7 | 33.0 | 34.1 | 35.0 | 35.7 | 33.9 | 32.3 | 30.9 | 29.7 | 28.7 | 27.8 | 27.0 | 26.3 | 25.7 | 25.2 |
| Run 2, water (°C) | 20.8 | 21.2 | 21.6 | 22.1 | 22.5 | 22.9 | 23.3 | 23.7 | 24.0 | 24.3 | 24.6 | 24.5 | 24.4 | 24.3 | 24.2 | 24.1 | 24.0 | 23.9 | 23.8 | 23.7 | 23.6 |
Worked from the table
- Heating, run 1. Sand rose 36.5 − 21.0 = 15.5 °C; water rose 25.0 − 21.0 = 4.0 °C. Ratio 15.5 / 4.0 = 3.9. Run 2: 14.9 / 3.8 = 3.9 again. The ideal ratio from specific heats alone is 4,184 / 830 = 5.0.
- Cooling, run 1. Sand fell 36.5 − 25.3 = 11.2 °C in ten minutes, 72% of what it had gained. Water fell 25.0 − 24.0 = 1.0 °C, 25% of its gain. Ten minutes after the lamp went off the sand was still warmer in absolute terms (25.3 against 24.0 °C) but had lost most of its gain, which is what the lesson’s prediction check is asking about: the water stays closer to its peak.
- Rates. Sand’s fastest heating is in the first minute, 2.1 °C/min, and it slows to 0.7 °C/min by minute 10 as the warm surface loses heat to the air faster. Water heats at a nearly steady 0.3–0.5 °C/min throughout. The curves have different shapes, not just different heights.
Why 3.9 and not 5
Four things in a real cup pull the ratio below the ideal, and every one of them is a source of error you can name. (1) The lamp heats the surface of the sand, and dry sand conducts heat poorly, so the top few millimeters are far hotter than the probe at 1 cm; the measured rise understates the sand’s surface and the ratio would be higher with a shallower probe. (2) Light penetrates water, so the water’s energy is spread through the whole 200 g while the sand’s stays near the top; both cups receive the same energy, but the sand concentrates it. (3) Water evaporates, carrying energy away as latent heat. (4) A hot surface loses energy faster than a cool one, so the sand is losing energy to the room even while the lamp is on, which flattens its curve after minute 6. Effects (1) and (2) work in opposite directions from (3) and (4); the measured ratio is what is left. Say which you think is largest and how you would test it (a probe at 2 mm, or a lid on the water).
From the cup to the coast
Water’s specific heat is 4,184 J/(kg·°C), the value used throughout this course (the Engineering ToolBox reference table lists 4,182 for pure water at 20 °C); quartz sand’s is 830 J/(kg·°C) in the same table. The lesson’s quiz: 0.50 kg of water warmed 4.0 °C absorbs 0.50 × 4,184 × 4.0 = 8,368 J. Giving 1,000 J to 100 g of each warms the water 2.4 °C and the sand 12.0 °C. The ocean adds three effects the cup cannot show: sunlight penetrates meters, waves and currents mix warmed water downward, and along the Pacific coast summer winds drive upwelling that brings cold deep water to the surface. So the sea surface near San Francisco changes only a few degrees over a year, and air that crosses it arrives at about the sea’s temperature.
NOAA’s 1991–2020 normals give the result. San Francisco Downtown (station USW00023272): July mean high 66.3 °F, January 57.8, range 8.5 °F. St. Louis Lambert International Airport (USW00013994), at almost the same latitude and more than 900 km from the nearest ocean water: 89.6 and 40.4, range 49.2 °F. Eureka, on the Pacific at 40.8° N: 63.1 and 55.1, range 8.0; Kirksville, in northern Missouri at 40.1° N: 85.8 and 34.4, range 51.4. And a warning against a too-simple rule: Norfolk, Virginia (USW00013737), sits on the Atlantic at Springfield’s latitude, yet its range is 38.7 °F against Springfield’s 45.3, because the prevailing westerly winds reach Norfolk across the continent. The range is set by how much of the air’s recent path lay over water, not by latitude, and not simply by whether a city is on a coast. The full thirteen-station table is in the Lesson 2.1 reading.
Planning your own test
Controlled variables in the recorded run: mass (200 g each), container (identical cups), lamp distance (20 cm to each surface), starting temperature (room, 21 °C), probe depth (1 cm), timing (one reading per minute). Independent variable: the material. Dependent variable: temperature over time. If you run the lab yourself, the two runs above give you an expected shape to compare against, not an answer to copy; a ratio anywhere from 3 to 5 is consistent with the physics, and a ratio below 2 usually means the probe was too deep in the sand or the lamp was closer to one cup than the other.
Sources: NOAA NCEI, U.S. Climate Normals 1991-2020 (ncei.noaa.gov); Engineering ToolBox, Specific Heat of Common Substances (engineeringtoolbox.com)