explain, with Missouri evidence, how the availability of resources, the occurrence of natural hazards and changes in climate have influenced where people live and how they build, and describe risk as hazard, exposure and vulnerability.
Instruction
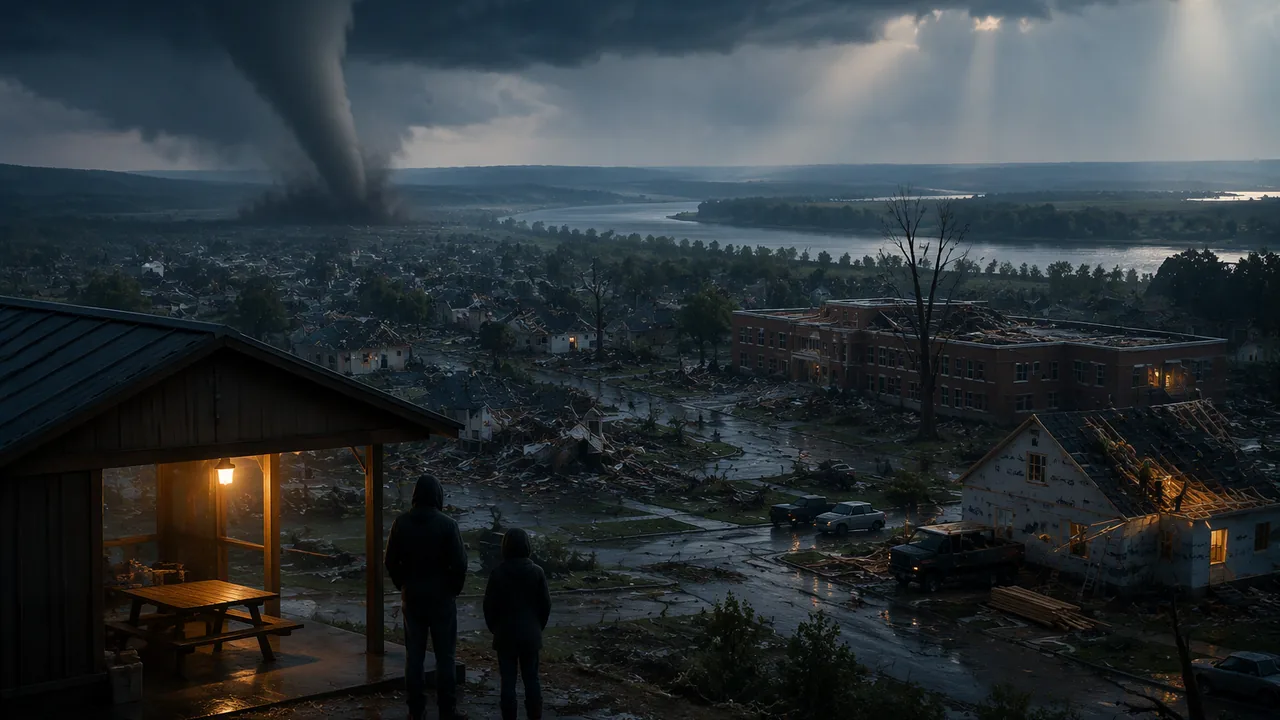
The phenomenon, and the people first. On the evening of May 22, 2011, a supercell thunderstorm produced a tornado that crossed Joplin, a city of more than 50,000 people in southwest Missouri. The National Weather Service rated it EF-5, with winds estimated above 200 mph. Its path was 22.1 miles long and up to 1 mile wide, and its most violent damage ran about 6 miles from western Joplin to Interstate 44 east of the city. It directly killed 158 people and injured more than 1,000. Families lost homes and loved ones, and Joplin spent years rebuilding its neighborhoods and schools. We study the science so that communities can make better choices. If this topic touches your own family’s experience, you can choose a different hazard for your work in this unit.
Resources shaped Missouri. People settle where resources are. Lead ore (galena) has drawn miners to southeast Missouri since 1720, first near Mine La Motte, and Missouri has been the top lead-producing state since 1907 in every year but one (Missouri Geological Survey). The Missouri and Mississippi rivers gave water, transport and rich bottomland soils, so cities and farms grew along them. Resource use also brought damage: lead from old mine waste reached yard soil in and around Fredericktown, and the U.S. Environmental Protection Agency cleaned up soil at more than 1,900 homes there.
Hazards shaped how we build. In 1811-1812 three great earthquakes, about magnitude 7.3 to 7.5, struck the New Madrid region. In 1990 Missouri passed a law (now section 319.200 of the Revised Statutes of Missouri) requiring every city and county expected to feel strong shaking from a magnitude 7.6 New Madrid earthquake to adopt seismic design standards for new construction. In the Great Flood of 1993 the Mississippi crested at 49.58 feet at St. Louis; afterward Missouri communities bought out flood-prone homes, and the U.S. Fish and Wildlife Service created the Big Muddy National Fish and Wildlife Refuge on flood-damaged land. After 2011 the Joplin School District built 14 tornado safe rooms rated for winds up to 250 mph, with FEMA paying 75 percent of the cost. Each disaster changed the rules, a pattern of hazard, loss and response.
Climate is shaping us now. Missouri’s hottest year on record was 2012, with a statewide average of 58.6 °F, 3.9 °F above the long-term average. That summer’s drought brought only 5.8 inches of rain from May through July, and by the end of July all 114 counties had been declared disaster areas. From 2022 to 2024 the state spent a record 102 consecutive weeks in drought. At the same time, heavy downpours are projected to become more frequent and intense, raising flood risk along the state’s big rivers (NOAA State Climate Summary for Missouri). More people now live and work in places exposed to these hazards.
Risk is more than the hazard. Emergency planners describe risk as the combination of three things: the hazard (how likely and how strong the event is), exposure (what people and property are in its path) and vulnerability (how easily they are harmed). A strong earthquake under empty forest is a hazard with little risk; a moderate one under a city of old, unreinforced brick buildings is a high risk. Many risk reductions work on exposure and vulnerability, which people can change, rather than on the hazard itself.
Worked example: expected annual loss (illustrative numbers). Suppose a river neighborhood has a 2% chance each year of a flood that would cause $50 million in damage. Its expected annual loss is 0.02 × $50,000,000 = $1,000,000 per year. A levee upgrade costing $3 million that prevents 60% of that loss saves about 0.6 × $1,000,000 = $600,000 a year, or $18 million over 30 years (ignoring interest). The benefit-cost ratio is 18 / 3 = 6. A ratio above 1 means the benefits exceed the costs. Real Missouri evidence points the same way: a FEMA study of flood buyouts in nine eastern Missouri communities found that acquisitions costing $44.2 million avoided $93.6 million in losses in the 2008 storms alone, a return of about 2.12 for every dollar.
Your questions. Aim them at choices: Which risks can a community reduce most cheaply? Who decides, and who pays?
📖 Read for this lesson
The reading opens over the lesson; close it to come back to exactly where you were. The checks below draw on it.
Formative check
Work through these before moving on. They are not graded — they tell you whether the standard below has landed yet.
Simulation & tools
Seeing a tornado’s track from space
Open the NASA Earth Observatory page Tornado in Joplin, Missouri. The image was taken by the ASTER instrument on NASA’s Terra satellite on May 30, 2011, eight days after the tornado. Read the color key: vegetation is red, buildings and pavement are shades of gray, clouds are nearly white, and the tornado track is light brown. Record (1) which way the track runs across the city, (2) its width at its widest, using the image’s scale bar, and (3) what is missing along the track compared with the neighborhoods beside it. Compare your width with the National Weather Service’s “up to 1 mile” and explain why the red of trees and lawns disappears along the path.
Page will not load? Use the image description and the National Weather Service path figures in this lesson’s reading.
Open NASA ↗ · NASA · Public domain (U.S. federal)
Under Missouri’s 1990 earthquake law (RSMo 319.200), which places must require seismic design standards for new construction?
A 2% annual chance of a $50 million loss gives an expected annual loss of $ million; a $3 million project that prevents 60% of it for 30 years has a benefit-cost ratio of .
A community can reduce its earthquake risk even though it cannot change how often earthquakes happen.
Build a timeline of at least five Missouri events in which a resource, a hazard or a change in climate changed how people lived or built (for example 1720, 1811-1812, 1990, 1993, 2011, 2012, 2019). For each, name the Earth-science cause and the human response. Then write two investigable questions about reducing risk in your own community.
How confident are you that you can explain how resources, hazards and climate have shaped human activity in Missouri and describe risk?
Practice
Work these on paper or in your notebook, then open Check your answer. Aim for all of Fluency and Application; try at least one Challenge.
Printable version: this unit’s practice workbook (PDF)
Fluency
Build speed and accuracy with the core skill.
- A neighborhood has a 1% chance per year of a flood causing $20 million of damage. What is its expected annual loss?
Check your answer
Answer: $200,000 per year0.01 × $20,000,000. - A project costs $3 million and saves $600,000 a year for 30 years (ignoring interest). What is its benefit-cost ratio?
Check your answer
Answer: 6$18,000,000 / $3,000,000. - The Joplin tornado’s path was 22.1 miles long. Convert to kilometers (1 mile = 1.609 km).
Check your answer
Answer: about 35.6 km
Application
Use the skill in context. Show your reasoning.
- A town can spend $2 million on seismic retrofits that cut a 2% annual chance of $40 million in damage by 70%, or $2 million on a levee that cuts a 1% annual chance of $60 million in damage by 90%. Compare the 30-year benefit-cost ratios (ignore interest).
Check your answer
Answer: retrofit 8.4; levee 8.1; the retrofit has the higher ratio - Explain the difference between hazard, exposure and vulnerability, using a tornado example for each.
Check your answer
Answer: Hazard: how likely and how strong a tornado is (a supercell producing an EF-5 with winds above 200 mph). Exposure: the people, homes and schools in its path, such as a city of more than 50,000 like Joplin. Vulnerability: how easily they are harmed (mobile homes, roofs not tied to walls, no safe room or basement). - For each event, name the Earth-science cause and the human response: the 1811-1812 New Madrid earthquakes; the Great Flood of 1993; the 2011 Joplin tornado.
Check your answer
Answer: Fault rupture in the New Madrid Seismic Zone, then Missouri’s 1990 law (RSMo 319.200) requiring seismic design for new construction where strong shaking is expected; heavy rain and record Mississippi and Missouri river levels, then buyouts of flood-prone homes and the Big Muddy National Fish and Wildlife Refuge; a supercell thunderstorm producing an EF-5 tornado, then 14 FEMA-funded school safe rooms in Joplin rated for 250 mph winds.
Challenge
Stretch problems. Expect to think before you write.
- A home has a 1% chance of serious tornado or flood damage in any year. What is the chance it is damaged at least once in 30 years, assuming each year is independent?
Check your answer
Answer: about 26%1 − 0.9930.
Review
Keep earlier skills sharp.
- Review (Unit 3): at 3.7 mm/yr, how much does sea level rise in 30 years?
Check your answer
Answer: about 11.1 cm
Missouri’s Hazard Record: Tornado, Shaking, Flood and Drought, by the Numbers
NWS Central Region Service Assessment, Joplin Tornado (2011); NIST NCSTAR 3 recommendations; NASA Earth Observatory, Tornado in Joplin, Missouri; FEMA news release on Missouri school safe rooms (2019); FEMA Loss Avoidance Study, Eastern Missouri Building Acquisition; RSMo 319.200; NOAA NCEI/NCICS State Climate Summary for Missouri; USGS Fact Sheet 2009-3071; all retrieved November 6, 2026 · Public domain (works of the U.S. government) and Missouri public records, with SLS original arithmetic
Why this reading. The lesson names the Joplin tornado, Missouri’s 1990 earthquake law, the 1993 flood buyouts, Joplin’s school safe rooms, the 2012 drought and a Missouri buyout benefit-cost result, and the timeline task asks for at least five dated Missouri events with causes and responses. This reading hosts the source behind every one of those numbers, with the hazard figures for earthquakes and climate that a proposal in Lesson 4.5 is likely to need. Lead-mining, 1811-1812 and 1993 flood details are in the companion reading Missouri’s Resources and Hazards (rlp-biob-supp-missouri-resources-hazards). All sources retrieved November 6, 2026.
1. The Joplin tornado, as the National Weather Service recorded it
| Item | Figure |
|---|---|
| Date | May 22, 2011, evening; a supercell thunderstorm |
| Rating and wind | EF-5 on the Enhanced Fujita Scale; maximum winds estimated at more than 200 mph |
| Path | 22.1 miles long and up to 1 mile wide; the EF-4/EF-5 damage path was roughly 6 miles long, from near Schifferdecker Avenue in western Joplin to near Interstate 44 east of the city, and generally ½ to ¾ mile wide |
| People | 158 direct and 4 indirect fatalities as of the report date; more than 1,000 injured |
| City | Population more than 50,000, density near 1,500 people per square mile |
| Warning | The assessment judged it essentially a “warned” event: advance notice was given and most people sought the best shelter available. Joplin’s sirens sounded in one 3-minute burst, and the assessment found that the majority of residents did not take protective action until they had additional, credible confirmation of the threat, partly because frequent siren use had made many complacent. |
Source: NWS Central Region Service Assessment, July 2011. NIST’s later investigation (NCSTAR 3, 2014) made 16 recommendations, including nationally accepted standards for tornado-resistant design and tornado shelters in new and existing multi-family, mercantile and assembly buildings in tornado-prone areas.
From space. NASA’s Terra satellite photographed the track on May 30, 2011 with its ASTER instrument. In NASA’s false-color image, vegetation is red, buildings and paved surfaces are shades of gray, clouds are nearly white, and the tornado track is light brown, because the storm stripped leaves, trees and lawns along its path.
2. A Missouri hazard-and-response timeline
| Year | Event | Earth-science or resource cause | Response | Source |
|---|---|---|---|---|
| 1720 | Lead mining begins near Mine La Motte | Galena (PbS) deposits in southeast Missouri | Settlement of the Lead Belt; Missouri the top U.S. lead producer since 1907 except 1962 | Missouri Geological Survey (companion reading) |
| 1811–1812 | New Madrid earthquakes, M7.5, M7.3, M7.5 | Fault rupture in the New Madrid Seismic Zone, in the middle of the North American Plate | Long-term: seismic design law of 1990 (below) | USGS (companion reading) |
| 1990 | Seismic construction law, RSMo 319.200 | USGS and state-geologist mapping of expected shaking | Places expected to feel Modified Mercalli intensity VII or more from a magnitude 7.6 New Madrid earthquake must require seismic standards for new construction, additions and alterations; the law says existing buildings need not be retrofitted | Revisor of Statutes |
| 1993 | Great Flood | Months of heavy rain; Mississippi crest 49.58 ft at St. Louis | Buyouts of flood-prone homes; Big Muddy National Fish and Wildlife Refuge (1994) | NWS, USFWS (companion reading); FEMA |
| 2011 | Joplin tornado | Supercell thunderstorm; EF-5 winds | 14 school safe rooms built by the Joplin School District since 2011, rated for winds up to 250 mph, FEMA paying 75% of the cost; they double as gyms and classrooms | NWS; FEMA (Aug. 28, 2019) |
| 2012 | Drought and Missouri’s hottest year | Only 5.8 in of rain from May to July, third-driest growing period since 1895; statewide average 58.6 °F, 3.9 °F above the 1895–2024 average | All 114 counties declared disaster areas by the end of July | NOAA State Climate Summary |
| 2019 | Missouri River flood | More than 100 levees breached or overtopped | L-536 levee setback in Atchison County reconnects 1,040 acres of floodplain | L-536 case study (companion reading) |
| 2022–2024 | Record-length drought | Moderate to exceptional drought for 102 consecutive weeks | Water-supply and farm planning | NOAA State Climate Summary |
3. Earthquake hazard, quantified
USGS Fact Sheet 2009–3071 states that many structures in Memphis, St. Louis and other central Mississippi Valley communities are vulnerable to severe ground shaking, and estimates the chance of an earthquake similar to one of the 1811–1812 shocks in the next 50 years at about 7 to 10 percent, and of a magnitude 6 or larger earthquake at 25 to 40 percent. Like the lesson’s flood example, these are probabilities a community can plan against by reducing exposure and vulnerability, even though it cannot lower the hazard.
4. Climate trends (NOAA State Climate Summary for Missouri)
- Annual average temperature has risen more than 1 °F since the beginning of the 20th century; the summers of the 1930s remain the hottest on record.
- Extreme precipitation events are projected to become more frequent and intense, potentially increasing floods; the state’s position in the lower basins of several large rivers makes it particularly susceptible to flooding.
- Drought is a natural part of Missouri’s climate, and rising temperatures are projected to make future droughts more intense.
5. Does mitigation pay for itself? A Missouri answer
FEMA’s loss-avoidance study of building acquisitions in nine communities in eight eastern Missouri counties reports a project cost of $44,153,436 and losses avoided of $93,636,111 in the 2008 storm events (both in 2008 dollars), a return on investment of 2.12. Check it: 93,636,111 ÷ 44,153,436 = 2.12. That ratio counts only the 2008 storms; every later flood the bought-out homes do not suffer adds to the benefit. The lesson’s levee example (ratio 6 over 30 years) is illustrative; the 2.12 is a measured Missouri result over a much shorter window.
Sources: NWS Central Region Service Assessment, Joplin, Missouri, Tornado, May 22, 2011 (July 2011) (weather.gov); NIST, Joplin Tornado Investigation: Recommendations (NIST NCSTAR 3, Table E-1) (nist.gov); NASA Earth Observatory, Tornado in Joplin, Missouri (ASTER image, May 30, 2011) (science.nasa.gov); FEMA news release, Missouri Schools Build Safe Rooms to Shelter from Tornadoes (Aug. 28, 2019) (fema.gov); FEMA, Loss Avoidance Study: Eastern Missouri Building Acquisition (case study, updated Feb. 11, 2021) (fema.gov); Revised Statutes of Missouri, section 319.200 (seismic construction ordinances; L. 1990 S.B. 539, as amended) (revisor.mo.gov); NOAA NCEI / NCICS, State Climate Summaries: Missouri (data through 2024) (statesummaries.ncics.org); USGS Fact Sheet 2009-3071, Earthquake Hazard in the New Madrid Seismic Zone Remains a Concern (pubs.usgs.gov)
Missouri’s Resources and Hazards, a Deer-Harvest Model and the L-536 Levee Setback
Missouri Geological Survey fact sheet PUB0658 (galena); USGS Summary of 1811-1812 New Madrid Earthquakes Sequence; NWS St. Louis, The Great Flood of 1993; USFWS Big Muddy National Fish and Wildlife Refuge pages; MDC news release, final deer harvest 2025-2026 (Jan. 16, 2026); Large-Scale Levee Setback on the Missouri River (L-536 case study, Sept. 2021); Smithsonian, White-tailed Deer in Eastern Forests; all retrieved November 5, 2026; deer model parameters illustrative · SLS original, citing U.S. government data (public domain) and Missouri state agency and project facts
Why this reading. The lesson gives you three jobs: explain, simulate and evaluate. This card puts the Missouri resource and hazard facts in one place, gives the full model with a ten-year check run, and lays out the L-536 levee setback’s numbers for your evaluation table.
Resources that placed people
| Resource | Evidence | Source |
|---|---|---|
| Lead ore (galena, PbS) | Important in Missouri since 1720; first found near Mine La Motte (Madison County). Missouri has been the top U.S. lead producer since 1907, except 1962. Old Lead Belt (Flat River–Bonne Terre) mined until 1972; all production now from the 35-mile Viburnum Trend. In 1992, nine mines produced 330,000 tons, 75 percent of the U.S. total. | Missouri Geological Survey fact sheet PUB0658 |
| Rivers and bottomlands | Water, transport and flood-built soils drew cities and farms to the Missouri and Mississippi. | General geography |
| Prairie soils | About 15 million acres of tallgrass prairie, mostly plowed for farmland. | MDC |
Hazards that changed choices
- New Madrid earthquakes (USGS preferred magnitudes): M7.5, December 16, 1811 (northeast Arkansas); M7.3, January 23, 1812 (Missouri); M7.5, February 7, 1812 (Reelfoot fault, Missouri and Tennessee).
- Great Flood of 1993 (National Weather Service): St. Louis crest 49.58 feet on August 1, 1993, nearly 20 feet above flood stage; the 52-foot floodwall held with 52 − 49.58 = 2.42 feet to spare. 18 percent of federal and 78 percent of non-federal levees failed or were overtopped.
- Response: Big Muddy National Fish and Wildlife Refuge, created September 1994 on flood-damaged land bought from willing sellers (much of it buried under several feet of sand); now almost 20,000 acres. U.S. Fish and Wildlife Service.
The deer harvest: real anchor numbers
MDC’s preliminary 2025-2026 harvest: 301,954 deer (145,222 antlered bucks, 25,129 button bucks, 131,603 does); 2024-2025: 275,656. Does were 131,603 ÷ 301,954 ≈ 43.6 percent of the 2025-2026 harvest.
The simulation (illustrative region)
Rules: next N = N + rN(1 − N/K) − hN, with r = 0.4, K = 30,000, starting N = 20,000. Understory index W = 100 − 2 × (N ÷ 1,000). These parameters are chosen for teaching, not measured for any Missouri county. Spreadsheet tip: if N is in B2, put =0.4*B2*(1-B2/30000) in C2 (growth), =0.2*B2 in D2 (harvest), =B2+C2-D2 in B3, and =100-2*B3/1000 for W; fill down.
Check run, h = 0.20 (rounded; W uses the end-of-year herd):
| Year | Growth rN(1 − N/K) | Harvest hN | Herd N at end of year | Understory index W |
|---|---|---|---|---|
| 1 | 2,667 | 4,000 | 18,667 | 62.7 |
| 2 | 2,821 | 3,733 | 17,754 | 64.5 |
| 3 | 2,899 | 3,551 | 17,102 | 65.8 |
| 4 | 2,941 | 3,420 | 16,623 | 66.8 |
| 5 | 2,965 | 3,325 | 16,263 | 67.5 |
| 6 | 2,979 | 3,253 | 15,989 | 68.0 |
| 7 | 2,987 | 3,198 | 15,778 | 68.4 |
| 8 | 2,992 | 3,156 | 15,615 | 68.8 |
| 9 | 2,995 | 3,123 | 15,487 | 69.0 |
| 10 | 2,997 | 3,097 | 15,386 | 69.2 |
Long-run levels (where growth equals harvest, N = K(1 − h/r)):
| Harvest rate h | Long-run herd | Deer harvested per year | Understory index W |
|---|---|---|---|
| 0 | 30,000 | 0 | 40 |
| 0.10 | 22,500 | 2,250 | 55 |
| 0.20 | 15,000 | 3,000 | 70 |
| 0.30 | 7,500 | 2,250 | 85 |
| 0.40 | 0 | 0 | 100 (no deer left) |
Limits to discuss: real r and K change with weather, disease and habitat; hunters harvest bucks and does differently; the browsing rule W is a stand-in for real vegetation surveys such as fenced-plot (exclosure) studies.
The L-536 levee setback (Atchison and Holt counties)
| Item | Value |
|---|---|
| 2019 flood on the Missouri River | More than 100 levees breached or overtopped; 1.2 million acres inundated; L-536 breached in 7 places |
| Project | Levee moved inland; 5 miles long; built August 2020 to summer 2021 |
| Floodplain reconnected | 1,040 acres |
| Flood reduction | Up to 0.83 feet lower water surface in the 100-year flood |
| Area protected | 20 square miles (12,800 acres) |
| Cost | About $103.5 million (about $100 million construction, about $3.5 million real estate); the Corps’ analysis found the setback the least-cost option compared with repairing the levee in place |
| Listed benefits | Lower flood velocities, less erosion and scour; floodplain habitat and fish spawning and nursery areas; groundwater recharge; nutrient retention |
| Partners | Atchison County Levee District, U.S. Army Corps of Engineers, NRCS, Missouri DNR, MDC, State Emergency Management Agency, The Nature Conservancy and others |
Sources: Missouri Geological Survey, Galena: Missouri’s Official State Mineral (PUB0658) (dnr.mo.gov); USGS, Summary of 1811-1812 New Madrid Earthquakes Sequence (usgs.gov); NWS St. Louis, The Great Flood of 1993 (weather.gov); USFWS, Big Muddy National Fish and Wildlife Refuge: About Us (fws.gov); USFWS, U.S. Fish and Wildlife Service to begin expansion of Big Muddy National Fish and Wildlife Refuge (2001) (fws.gov); MDC, MDC reports final deer harvest for season at 301,954 (mdc.mo.gov); Large-Scale Levee Setback on the Missouri River (L-536 – A Case Study), Sept. 2021 (nature.org); Smithsonian’s National Zoo and Conservation Biology Institute, White-tailed Deer in Eastern Forests (nationalzoo.si.edu)