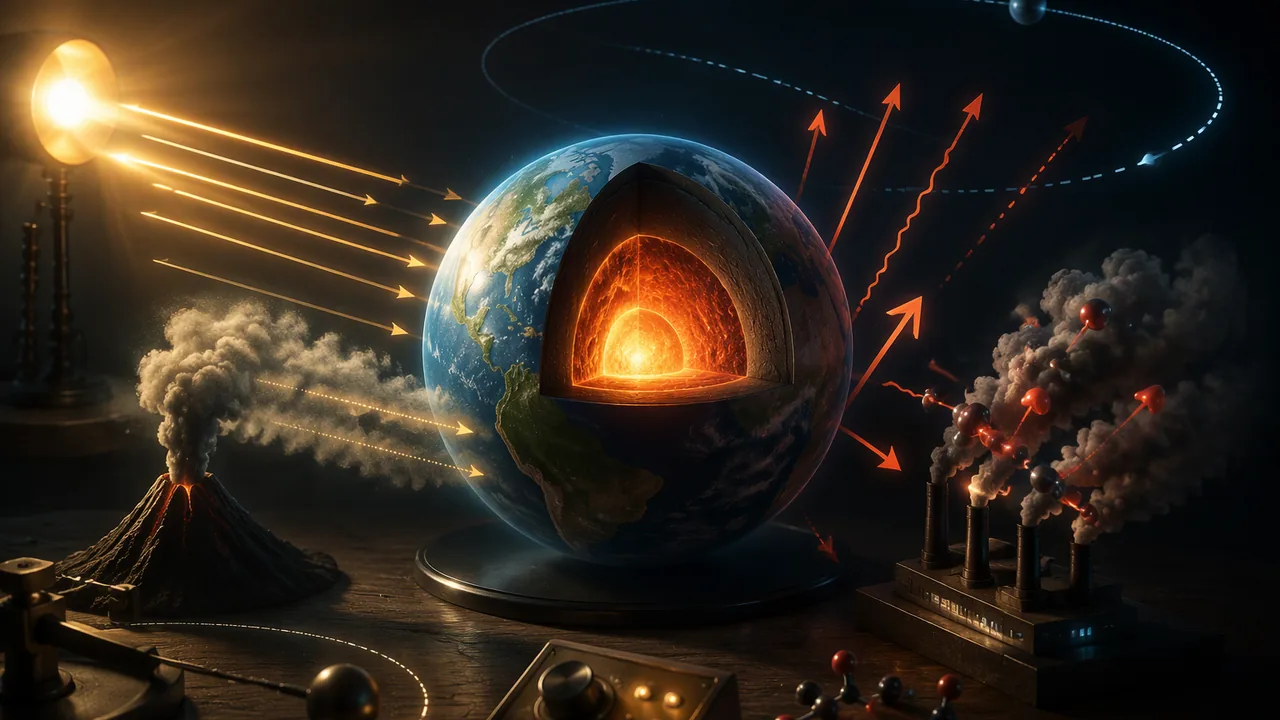
compare the natural and human causes of climate change by the size of their effect on Earth’s energy flow and the time scale on which they act, and argue from evidence which explain the warming of recent decades.
Instruction
The same rule for every cause. Earth’s climate changes when the flow of energy in and out changes. Anything that changes how much sunlight arrives, how much is reflected, or how easily infrared energy escapes to space is a climate forcing, measured in watts per square meter (W/m2) of Earth’s surface. Positive forcings warm; negative ones cool. Climate has changed naturally many times, so the scientific question is always: which forcing, how large, and on what time scale?
1. Orbital cycles (tens of thousands of years). Earth’s orbit and tilt change slowly and regularly: the orbit’s eccentricity varies over about 100,000 and 405,000 years, the axis tilt between about 22.1° and 24.5° over about 41,000 years, and the axis wobbles (precesses) over about 23,000 years. These Milankovitch cycles hardly change the total sunlight Earth receives, but they shift how much reaches high northern latitudes in summer. Ice cores and ocean sediments show ice ages coming and going about every 100,000 years for the last 800,000 years, in step with these cycles and amplified by feedbacks from ice and carbon dioxide. They are too slow to explain changes over decades.
2. The Sun (years to centuries). The Sun’s output rises and falls by about 0.1% over its 11-year sunspot cycle. 0.1% of 1,361 W/m2 is about 1.4 W/m2; averaged over the whole globe and after reflection (× 0.7 / 4), that is only about 0.24 W/m2. Satellites have measured the Sun directly since 1978, and its average output has not risen since then, while Earth has warmed.
3. Volcanoes (one to a few years). Large eruptions blast sulfur gases into the stratosphere, where they form tiny droplets that reflect sunlight. After Mount Pinatubo in the Philippines erupted in June 1991, global temperatures fell by roughly 0.5 °C for a year or two, then recovered as the droplets settled out. Volcanoes also emit carbon dioxide, but far less each year than human activities.
4. Greenhouse gases (decades to centuries). Carbon dioxide absorbs infrared energy leaving Earth. Scientists estimate its forcing with the relation ΔF ≈ 5.35 ln(C/C0). From the pre-industrial level of about 280 ppm to the 2024 Mauna Loa average of 424.61 ppm, ΔF ≈ 5.35 × ln(1.516) ≈ 2.2 W/m2, roughly nine times the size of the solar cycle’s swing, and it acts in one direction, year after year. Doubling carbon dioxide gives 5.35 ln 2 ≈ 3.7 W/m2.
Fingerprints. Different causes leave different patterns. If a brighter Sun were warming Earth, the whole atmosphere, including the stratosphere, would warm. Instead, measurements show the lower atmosphere warming and the stratosphere cooling, which is the pattern expected when greenhouse gases trap more energy lower down. Nights have also warmed faster than days in many places, another greenhouse signature.
Your argument. A strong argument compares causes by size and time scale, with numbers, and explains why one fits the recent evidence and the others do not. Before you finish, write down the strongest objection a skeptical reader could raise and answer it: the goal is to follow the evidence.
📖 Read for this lesson
The reading opens over the lesson; close it to come back to exactly where you were. The checks below draw on it.
Lab: A Model Volcanic Haze: Does Cloudy Air Cool the Ground?
Question. Does a haze of tiny particles between a light source and the ground reduce how much the ground warms, as volcanic aerosols did after Pinatubo?
Materials
- Two clear zip-top bags or clear plastic lids, each holding 200 mL of water
- About 2 mL of milk (a few drops) to make the ‘haze’
- Two thermometers and two squares of black construction paper
- A desk lamp (60 W-equivalent) or direct sunlight
- Two equal stacks of books or cups to hold each bag about 5 cm above the paper
- Stopwatch
- Wear safety goggles, because water is used near an electrical lamp; keep water and wet hands away from the cord and switch.
- Do not touch the hot bulb or shade, and let the lamp cool before moving it. Do not drink the milk; wash hands after the lab.
Procedure
- Lay the two black squares side by side under the lamp, with a thermometer bulb on each. Record the starting temperatures.
- Fill both bags with 200 mL of water. Add the milk to one bag only and mix to make a uniform haze.
- Support each bag 5 cm above its black square so the lamp’s light must pass through the water to reach the paper.
- Switch on the lamp and record both temperatures every minute for 10 minutes.
- Swap which side has the hazy bag and repeat, to check that the lamp lights both sides equally.
Data
| Time (min) | 0 | 2 | 4 | 6 | 8 | 10 |
|---|---|---|---|---|---|---|
| Under clear water (°C) | ||||||
| Under hazy water (°C) |
Record every minute; the table shows every second minute to save space. Repeat with the sides swapped.
Analysis
- Claim: does the haze reduce warming of the ground? Use the temperature rises under the two bags, in both runs, as evidence, and explain how particles scatter and reflect light.
- Relate the model to Mount Pinatubo: what do the milk particles stand for, and why did the real cooling last only a year or two?
- Why can a haze that lasts two years not explain a warming trend that has lasted decades?
- Sources of error: how do unequal lamp distance, evaporation and the bag’s own shadow affect the result, and why does swapping sides help?
If you cannot do this lab in person: Hold a clear glass and a milky glass of water over two thermometers in sunlight at home, or analyze the recorded run (two runs, sides swapped) in this lesson’s reading.
Formative check
Work through these before moving on. They are not graded — they tell you whether the standard below has landed yet.
Simulation & tools
Carbon dioxide and temperature since 1960
Open CODAP and make a table with three columns, Year, CO2 (ppm) and Anomaly (°C), from the data below (NOAA Mauna Loa annual means; NASA GISTEMP v4 anomalies relative to 1951-1980, retrieved November 2026). Graph Anomaly against Year and add a least-squares line; record its slope in °C per decade. Then graph Anomaly against CO2. Mark 1991 (Pinatubo). Which driver’s pattern matches the long-term temperature trend?
| Year | 1960 | 1965 | 1970 | 1975 | 1980 | 1985 | 1990 | 1995 | 2000 | 2005 | 2010 | 2015 | 2020 |
|---|---|---|---|---|---|---|---|---|---|---|---|---|---|
| CO₂, Mauna Loa annual mean (ppm) | 316.91 | 320.04 | 325.68 | 331.13 | 338.76 | 346.35 | 354.45 | 360.97 | 369.71 | 379.98 | 390.10 | 401.01 | 414.21 |
| GISTEMP anomaly vs 1951-1980 (°C) | -0.02 | -0.11 | 0.03 | -0.01 | 0.26 | 0.12 | 0.45 | 0.45 | 0.39 | 0.68 | 0.72 | 0.89 | 1.01 |
No device? Plot both series by hand on graph paper with two vertical axes and draw the best line by eye.
Open in a new tab ↗ · CODAP, Concord Consortium · MIT open source
Which driver acts on the time scale of tens of thousands of years and paced the ice ages?
Using ΔF = 5.35 ln(C/280), carbon dioxide at 424.61 ppm gives a forcing of about W/m², compared with about W/m² for the solar cycle.
A cooling stratosphere while the lower atmosphere warms is the pattern expected if a brighter Sun were causing recent warming.
Write a CER argument answering: ‘What is the main cause of the global warming measured since 1960?’ Compare at least three drivers by the size of their forcing and their time scale, use your graph as evidence, and rebut the claim ‘It’s just the Sun.’ Then write the strongest question a skeptical reader could ask about your argument and answer it, in writing or on a recording.
How confident are you that you can compare climate drivers by size and time scale and argue from evidence about recent warming?
Practice
Work these on paper or in your notebook, then open Check your answer. Aim for all of Fluency and Application; try at least one Challenge.
Printable version: this unit’s practice workbook (PDF)
Fluency
Build speed and accuracy with the core skill.
- Use ΔF = 5.35 ln(C/280) to find the forcing when CO2 reaches 350 ppm.
Check your answer
Answer: about 1.19 W/m2 - Find the forcing for a doubling of CO2 (560 ppm).
Check your answer
Answer: about 3.71 W/m25.35 ln 2. - The Sun’s output varies by 0.1% of 1,361 W/m2. Averaged over the globe after reflection (× 0.7 / 4), how large is that change?
Check your answer
Answer: about 0.24 W/m2
Application
Use the skill in context. Show your reasoning.
- Mauna Loa CO2 was 316.91 ppm in 1960 and 414.21 ppm in 2020. Find the forcing (relative to 280 ppm) in each year and the change.
Check your answer
Answer: 1960 about 0.66; 2020 about 2.09; change about 1.43 W/m2 - After the June 1991 eruption of Pinatubo, global temperature fell about 0.5 °C for a year or two. Why did the cooling not last?
Check your answer
Answer: The sulfate droplets that reflected sunlight settled out of the stratosphere within a few years, so the forcing disappeared. - Match each driver to its time scale: Milankovitch cycles, the solar cycle, a large volcanic eruption, rising greenhouse gases.
Check your answer
Answer: Milankovitch: tens of thousands of years. Solar cycle: about 11 years. Eruption: one to a few years. Greenhouse gases: decades to centuries.
Challenge
Stretch problems. Expect to think before you write.
- How many times larger is today’s CO2 forcing (424.61 ppm) than the solar-cycle swing of about 0.24 W/m2? Explain why a forcing that acts in one direction matters more than one that swings up and down.
Check your answer
Answer: about 9 times; a cycle averages out over 11 years, while the CO2 forcing keeps adding energy every year
Review
Keep earlier skills sharp.
- Compare a magnitude 7.0 earthquake with a magnitude 6.0 earthquake. About how many times larger is the ground-motion amplitude, and about how many times more energy is released?
Check your answer
Answer: amplitude ≈ 10.0 times; energy ≈ 32 timesEach whole step in magnitude is 10 times the amplitude and about 32 times (101.5) the energy.
Nine Times the Sun: Forcings by Size and Time Scale, With the Series Behind the Graph
NOAA GML co2_annmean_mlo.txt and NASA GISTEMP v4 GLB.Ts+dSST.csv, retrieved November 6, 2026; USGS Fact Sheet 113-97 on the 1991 Pinatubo eruption, retrieved November 6, 2026; SLS illustrative haze-lab run · Public domain (works of the United States government), with SLS original arithmetic and illustrative data
Why this reading. Your argument compares climate drivers by the size of their forcing and their time scale, and rebuts “it’s just the Sun.” The lesson gives the formula and a few results; this reading gives the whole table with the arithmetic shown, the two data series your graph is built on with their sources checked against the agencies’ files, the published measurement of what Pinatubo did, and a recorded run of the haze lab for anyone without a lamp. The haze run is SLS teaching data, labeled illustrative; everything else is measured or computed from measurements.
Table 1. Climate drivers by forcing and time scale
A forcing is a change in Earth’s energy balance, in watts per square meter of surface. Positive warms, negative cools. The carbon dioxide relation ΔF = 5.35 ln(C/C0) is the standard simplified expression used in assessment reports; 280 ppm is the pre-industrial level from ice cores, 424.61 ppm the 2024 Mauna Loa annual mean (NOAA GML).
| Driver | Time scale | Forcing (W/m2) | Evidence |
|---|---|---|---|
| Orbital (Milankovitch) cycles | About 23,000, 41,000 and 100,000 years | Redistributes sunlight by latitude and season; total changes by well under 1 W/m2 | Paces the ice ages in the 800,000-year ice-core record; far too slow for decades |
| Solar cycle | 11 years | 0.1% of 1,361 W/m2 = 1.36 at the top of the atmosphere; × 0.7 / 4 = 0.24 W/m2 at the surface, up and down | Measured by satellites since 1978; no upward trend while Earth warmed |
| Volcanic aerosols (Pinatubo, June 1991) | 1–3 years | Negative; USGS: about 20 million tons of SO2 into the stratosphere | USGS: global temperatures dropped temporarily, 1991 through 1993, by about 0.5 °C (1 °F) |
| Carbon dioxide, 280 to 424.61 ppm | Decades to centuries, one direction | 5.35 ln(424.61/280) = 5.35 × 0.416 = 2.23 W/m2 | About nine times the solar cycle’s swing (2.23 / 0.24 = 9.3), and it does not reverse |
| Carbon dioxide doubled | — | 5.35 ln 2 = 3.71 W/m2 | The standard benchmark for climate sensitivity |
The lesson’s fill-in is the fourth row against the second: 2.2 W/m2 against 0.24. The solar figure deserves its arithmetic in full because “0.1%” sounds like nothing and “1.4 W/m2” sounds like something: the Sun’s output varies by about 0.1% over the cycle, 0.001 × 1,361 = 1.36 W/m2 facing the Sun; averaged over the sphere (÷ 4) and after 30% reflection (× 0.7), 0.24 W/m2. And it is a swing, up for five or six years and back down, not a trend.
Table 2. The two series in your graph, checked against the source files
Carbon dioxide: NOAA Global Monitoring Laboratory, annual means at Mauna Loa (file co2_annmean_mlo.txt, uncertainty 0.12 ppm). Temperature: NASA GISS GISTEMP v4, global land-ocean annual anomaly relative to 1951–1980 (file GLB.Ts+dSST.csv, column J-D). Both retrieved 2026-11-06; every value below matches the lesson’s table. (GISS revises the series slightly as stations are added; in this retrieval 2015 reads +0.89 and 1994 +0.31.)
| Year | 1960 | 1965 | 1970 | 1975 | 1980 | 1985 | 1990 | 1995 | 2000 | 2005 | 2010 | 2015 | 2020 |
|---|---|---|---|---|---|---|---|---|---|---|---|---|---|
| CO2, Mauna Loa annual mean (ppm) | 316.91 | 320.04 | 325.68 | 331.13 | 338.76 | 346.35 | 354.45 | 360.97 | 369.71 | 379.98 | 390.10 | 401.01 | 414.21 |
| GISTEMP anomaly vs 1951–1980 (°C) | -0.02 | -0.11 | +0.03 | -0.01 | +0.26 | +0.12 | +0.45 | +0.45 | +0.39 | +0.68 | +0.72 | +0.89 | +1.01 |
Fitting a least-squares line to the thirteen temperature values against year gives a slope of 0.18 °C per decade. Against CO2 instead of year, the slope is 0.0113 °C per ppm: about 1.1 °C for each 100 ppm added. The intercept of that second fit (-3.68 °C at 0 ppm) is meaningless, which is a reminder that a fitted line is a description, not a law; the physics is in Table 1.
Table 3. Pinatubo in the annual record
| Year | 1988 | 1989 | 1990 | 1991 | 1992 | 1993 | 1994 | 1995 |
|---|---|---|---|---|---|---|---|---|
| GISTEMP anomaly (°C) | +0.39 | +0.27 | +0.45 | +0.41 | +0.22 | +0.23 | +0.31 | +0.45 |
The eruption was in June 1991. GISTEMP’s annual anomaly fell from +0.45 °C in 1990 to +0.22 in 1992 and +0.23 in 1993, then returned to +0.45 by 1995. The USGS fact sheet on the eruption puts the global cooling at about 0.5 °C during 1991–1993; the annual-mean series shows about half that against the 1990 value, and more against where the trend would have been. Either way, the whole effect is gone within three years, because sulfate droplets settle out of the stratosphere. A driver that cools for two years cannot explain a warming that has lasted five decades; it can only explain the dips.
Table 4. A recorded run of the haze lab (SLS illustrative data)
Two zip-top bags each holding 200 mL of water, one with 2 mL of milk stirred in; each supported 5 cm above a black paper square with a thermometer bulb on it; 60 W-equivalent lamp centered 30 cm above the pair; readings every minute for 10 minutes, then sides swapped and repeated. Room 21 °C. Constructed teaching numbers, for anyone who cannot run the lab at home.
| Minute | 0 | 1 | 2 | 3 | 4 | 5 | 6 | 7 | 8 | 9 | 10 |
|---|---|---|---|---|---|---|---|---|---|---|---|
| Run 1, under clear water (°C) | 21.0 | 22.0 | 23.1 | 24.1 | 25.0 | 25.8 | 26.5 | 27.1 | 27.6 | 28.0 | 28.4 |
| Run 1, under hazy water (°C) | 21.0 | 21.7 | 22.5 | 23.2 | 23.9 | 24.5 | 25.0 | 25.4 | 25.8 | 26.1 | 26.4 |
| Run 2 (sides swapped), clear (°C) | 21.1 | 22.0 | 23.0 | 24.0 | 24.9 | 25.6 | 26.3 | 26.9 | 27.4 | 27.8 | 28.2 |
| Run 2 (sides swapped), hazy (°C) | 21.1 | 21.8 | 22.5 | 23.3 | 23.9 | 24.5 | 25.0 | 25.4 | 25.8 | 26.1 | 26.3 |
Run 1: clear +7.4 °C, hazy +5.4 °C; run 2 with sides swapped: clear +7.1, hazy +5.2. The haze cut the warming by about 2 °C, 27–28%, in both runs, and swapping sides rules out one side of the lamp simply being brighter. The milk droplets stand for volcanic sulfate: both scatter incoming light back upward before it reaches the ground. The model’s limit is also its lesson: the milk stays in the bag, while Pinatubo’s droplets fell out of the sky in two years.
The fingerprint the Sun cannot leave
If the Sun were the cause, the whole atmosphere would warm. Observations show the lower atmosphere warming and the stratosphere cooling, and nights warming faster than days; both are expected when greenhouse gases absorb more of the infrared leaving the surface, and neither is expected from a brighter Sun. Add the time-scale argument from Table 1 and the size argument (2.2 against 0.24) and the rebuttal has three independent legs.
Sources: NOAA GML, annual mean CO2 at Mauna Loa (data file) (gml.noaa.gov); NASA GISS, GISTEMP v4 global land-ocean annual means (data file) (data.giss.nasa.gov); USGS Fact Sheet 113-97, The Cataclysmic 1991 Eruption of Mount Pinatubo (pubs.usgs.gov)