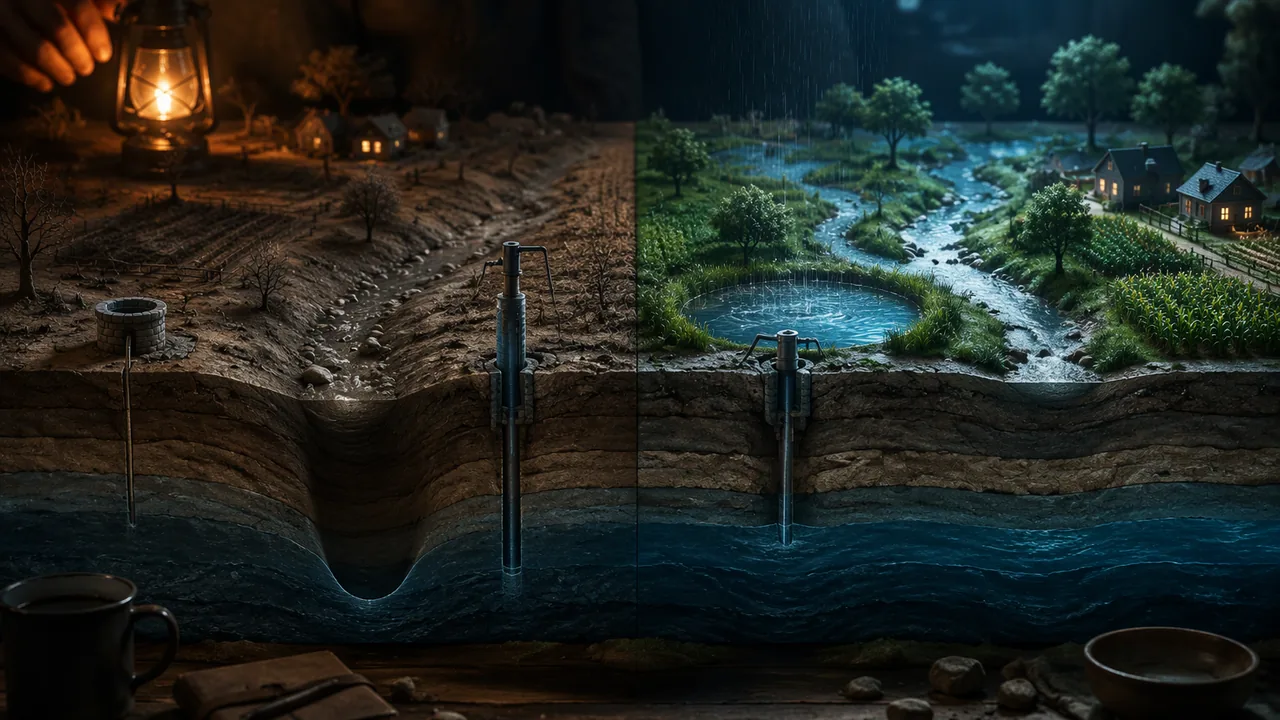
construct and defend a water plan for an overdrawn groundwater basin, using a computational model, stated criteria and constraints, and evidence of feedbacks between Earth’s systems.
Instruction
The question. How should an overdrawn groundwater basin be managed so that it can supply people, farms and ecosystems for the long term? You may use the model basin from Lesson 1.4 or research a real Missouri aquifer, the Bootheel’s alluvial aquifer or the Ozark aquifer around Springfield, with USGS and Missouri Department of Natural Resources (MDNR) sources. Either way, your plan must be built on evidence and tested with a model.
What to include.
- The system. Describe the basin’s water budget: its stores, inflows and outflows, and how rain, rivers, reservoirs and groundwater are connected.
- The problem and its feedbacks. Show that the basin is in overdraft, with numbers, and explain at least one feedback, such as drought leading to more pumping, or a cone of depression that dries nearby shallow wells and lowers the springs and streams the aquifer feeds.
- Criteria and constraints. Criteria are what a good solution must achieve (for example, storage stable over 20 years, no household well going dry). Constraints are limits it must respect (cost, farm jobs, safe drinking water for every household, water left in rivers for fish). Prioritize them.
- Two strategies, modeled. Run at least two strategies year by year and graph storage over 20 years.
- Recommendation and trade-offs. Recommend one strategy, and say honestly who gains and who pays.
A worked comparison. In the model basin (2,000,000 acre-feet, recharge 400,000, pumping 550,000), a 27% pumping cut balances the budget at once. Managed recharge of 100,000 acre-feet in wet years, alone, does not: with two wet years in every five it adds an average of only 40,000 a year against a 150,000 overdraft, so storage keeps falling by about 110,000 a year. Combining a 15% cut (overdraft 67,500) with that recharge leaves a deficit of about 27,500 a year: close, but not yet sustainable. Numbers like these let decision-makers see the trade-off between cuts that fall on farms now and projects that cost money to build.
Sources and respect. Cite Earle’s Physical Geology, USGS, MDNR and the U.S. Army Corps of Engineers for facts you did not measure. Groundwater decisions affect real communities, including farm families, farmworkers and rural households on shallow wells; write about them accurately and with respect.
Limits. Name what your model leaves out, such as differences within the basin, hotter, drier summers like 2012 becoming more common, and uncertainty in recharge estimates, and how each could change your recommendation.
📖 Read for this lesson
The reading opens over the lesson; close it to come back to exactly where you were. The checks below draw on it.
Formative check
Work through these before moving on. They are not graded — they tell you whether the standard below has landed yet.
Recharge is 400,000 acre-feet a year and pumping is 550,000. What percentage cut in pumping balances the budget?
‘Every household keeps safe drinking water’ is an example of a constraint on a groundwater plan.
Write the ‘criteria and constraints’ section of your plan: at least two measurable criteria and three constraints, ranked, with one sentence each explaining why it matters.
How confident are you that you can construct and defend a groundwater plan built on a computational model and stated criteria and constraints?
Unit 1 checkpoint
Do this before you start the task. It covers the whole unit and tells you what to review first.
Truman Lake holds 1,297,500 acre-feet out of a flood-pool capacity of about 5,190,000. What percentage of capacity is that?
Reservoirs such as Truman Lake and the Missouri River mainstem lakes store water in wet periods and release it in dry ones.
Which is a reinforcing feedback?
A 300 mL sample holding 105 mL of water in its pores has a porosity of %.
Clay is highly porous but has very low permeability.
Why can a shallow well go dry next to a deep irrigation well during a drought?
Who must register with Missouri’s Department of Natural Resources and report water use each year?
Recharge 300,000 and pumping 360,000 acre-feet per year change storage by acre-feet per year.
In a stock-and-flow model of a basin, which equation is correct?
‘Every household keeps safe drinking water’ is a criterion, not a constraint.
Submit: A Water Plan for One Basin (1,000-1,300 words) + three-minute defense
Task: Write an evidence-based management plan for an overdrawn groundwater basin. Include (1) the basin’s water budget as a system; (2) evidence of overdraft and at least one feedback; (3) prioritized criteria and constraints; (4) a computational model, in a spreadsheet, JupyterLite or on paper, comparing at least two strategies over 20 years, with a graph; (5) a recommendation with trade-offs and a limits paragraph. Cite USGS, MDNR, the U.S. Army Corps of Engineers and Earle for facts you did not measure.
Submission workflow
- Stage 1 — Plan. Your basin, its budget numbers, your prioritized criteria and constraints, and the two strategies you will model.
- Stage 2 — Self-checked draft. Rerun your model from your own stated numbers in a fresh sheet or on fresh paper, check it against the worked runs in the Lesson 1.4 reading, check your graph, and mark any claim that has no evidence behind it. Submit your check notes and your revision plan.
- Stage 3 — Final plan. 1,000-1,300 words with the model, graph, recommendation, trade-offs, sources and limits.
- Stage 4 — Defense. A three-minute recorded presentation, followed by a written answer to one question about the trade-offs in your plan.
How it is scored
| Criterion | What proficient looks like |
|---|---|
| Computational model (9-12.ESS3.C.1, SEP.5) | Model follows storage = storage + recharge − pumping correctly for at least two strategies over 20 years, with a clear graph. |
| Feedbacks between systems (9-12.ESS2.A.2, CCC.4) | Explains at least one feedback with evidence, such as subsidence reducing storage. |
| Criteria and constraints (9-12.ETS1.A.1) | States and prioritizes measurable criteria and realistic constraints, including societal needs. |
| Recommendation (SEP.6, WHST.9-10.1) | Recommends a strategy supported by model results; trade-offs and who bears them are stated honestly. |
| Use of sources (RST.9-10.1) | Specific evidence from USGS, MDNR, the Corps of Engineers and Earle cited accurately. |
| Defense | Answers a question about trade-offs with evidence from the model. |
Evidence Pack for a Basin Plan: The Model Basin Specified and the Missouri Record Behind It
SLS reading for Earth Science B, consolidating the unit’s hosted USACE, NOAA, USGS and MDNR figures with identifiers; retrieved November 6, 2026 · SLS original
Why this reading. The task’s rubric awards a line for specific evidence from USGS, the Missouri Department of Natural Resources (MDNR), the Corps of Engineers and Earle, cited accurately, and the task lets you build your plan on the model basin or on a real Missouri aquifer. This dossier gathers, in one place, the evidence this unit has hosted, with the identifier for each figure, so that a plan can cite a measurement rather than a website, and so that anyone rerunning your model, including you at Stage 2, can find every number you used. It also sets out the model basin fully enough to be treated as a case.
Part 1. The model basin, specified
| Element | Value | Where it comes from |
|---|---|---|
| Usable storage at the start | 2,000,000 AF | Lesson 1.4 |
| Average recharge | 400,000 AF/yr | Lesson 1.4 |
| Wet-dry recharge sequence | 700,000 AF in years 1-2, 6-7, 11-12, 16-17; 200,000 otherwise (mean 400,000) | Lesson 1.4 simulation |
| Pumping | 550,000 AF/yr; overdraft 150,000 AF/yr | Lesson 1.4 |
| Pumping cut that balances | 150,000 / 550,000 = 27.3% (pumping 400,000) | Lesson 1.5 quiz |
| Managed recharge option | +100,000 AF in each wet year = 40,000 AF/yr average | Lesson 1.4 |
| Dry-well rule (to add) | Below a storage threshold you choose, shallow wells go dry and springs lose flow; count the years below it | Lesson 1.4; well records in the 1.3 reading |
The three lesson comparisons, checked against the runs in the Lesson 1.4 reading: the balancing cut alone holds storage at 2,000,000 AF every year; managed recharge alone still loses about 110,000 AF a year (ends 2,200,000 AF below the start); a 15% cut plus managed recharge loses 27,500 AF a year and ends at 1,450,000 AF. Any plan built on this basin should reproduce those three before it tries a fourth.
Part 2. Evidence for the “system” and “feedbacks” sections
| Claim you may need | Figure | Source and identifier |
|---|---|---|
| River inflow swings from year to year | Upper Missouri runoff 61.0 MAF in 2011 (record); 19.5 MAF in 2012 (77% of normal) | USACE, Missouri River Mainstem System 2012 summary (Lesson 1.1 reading, Table 1) |
| 2012 was a severe Missouri drought | 31.03 in of precipitation (1991-2020 average 43.45), 7th driest since 1895; April-July 9.50 in, about half of normal; June-August 78.2 °F, 11th hottest | NOAA NCEI Climate at a Glance, Missouri statewide |
| Reservoirs are drawn down in drought | Mainstem system 56.4 to 48.9 MAF, Aug. 1 to Nov. 30, 2012; 99.7% of capacity July 2, 2011, 66.3% March 1, 2013 | USACE 2012 summary; USACE CWMS, office NWDM |
| Groundwater carries Missouri’s irrigation | 2015: 67% of non-power withdrawals and 95% of irrigation water from wells; 8 southeastern counties had 84% of irrigated acres | USGS county water-use data for 2015 (Dieter and others, 2018) (Lesson 1.2 reading) |
| Pumping lowers the water table seasonally | Malden well: 12.53 ft (Mar. 13, 2012) to 19.19 ft (Sept. 11, 2012) below land surface; 12.97 ft Aug. 20, 2013 | MDNR well, USGS site 362955089581801 (Lesson 1.3 reading) |
| Cones of depression dry shallow wells | High-capacity Bootheel wells pump up to 3,000 gal/min; overlapping cones can leave nearby shallow wells dry until pumping stops | MDNR PUB3001, Southeastern Lowlands Groundwater Province |
| Slow recharge lets a cone grow for decades | Springfield: nearly 300 ft decline by 1974, 350 ft by 1987, about 500 ft by 1996; Stockton Lake pipeline completed 1996 | USGS SIR 2010-5227 (Richards, 2010) |
| Aquifer materials differ | Specific yield: gravel 19%, sand 22%, clay 2% (porosity 20, 25, 50%) | USGS Water-Supply Paper 2220 (Heath, 1983), p. 8 |
| What the law requires | Users able to pump 100,000 gal/day register with MDNR and report yearly; 2020 Missouri Water Resources Plan | Sections 256.400-256.433 and 640.415 RSMo; MDNR Major Water Users page |
Part 3. Criteria and constraints, with numbers attached
A criterion is measurable; a constraint is a limit. The examples below use the figures above so that each can be tested against the model rather than asserted.
- Criterion: storage in year 20 at least equal to year 1 (the lesson’s), or storage never below a floor you set, for instance 1,400,000 AF, because the lowest point is where wells go dry. Run F in the Lesson 1.4 reading meets the second (its lowest point is 1,450,000) and fails the first; say which you rank higher and why.
- Criterion: no household well goes dry, tested by whether storage ever crosses your dry-well threshold.
- Constraint: every household keeps safe drinking water; household wells are shallower than irrigation wells, so this is a floor on the water table, not on total storage.
- Constraint: farm production and jobs; a 27% cut in pumping is a 27% cut in irrigation water unless recharge or another source replaces it, and in a dry summer that means smaller harvests.
- Constraint: money; managed recharge and pipelines need land, pumps and permits (Springfield’s Stockton Lake pipeline took from the late 1980s to 1996), and recharge only works in wet years, of which the sequence has two in five.
- Constraint: water left for rivers, springs and wildlife; groundwater that is pumped out does not reach the springs and streams the aquifer feeds.
Part 4. If you choose a real aquifer
The rubric does not ask you to find new data; it asks you to use sources accurately. A real-aquifer plan can be built from what this unit hosts: take the Bootheel alluvial aquifer or the Ozark aquifer around Springfield, use the well records and cone-of-depression measurements as the feedback, use the 2012 rainfall and reservoir records as the inflow story, and model a budget with the lesson’s structure and your own stated assumptions for recharge and pumping, labeled illustrative. State clearly which numbers are measured (cite them) and which are your assumptions (label them). That is what a water agency’s plan does, at far greater length.
Part 5. How to cite
Give the agency, the product, the identifier and the date, for instance: “MDNR monitoring well near Malden, USGS site 362955089581801, depth to water September 11, 2012 (retrieved 2026-11-06)”; “USGS, Richards, Groundwater-flow model and effects of projected groundwater use in the Ozark Plateaus aquifer system in the vicinity of Greene County, Missouri, SIR 2010-5227″; “Earle, Physical Geology, 2nd ed., chapter 14.” Anyone who reruns your model should be able to find every input in one of those places or in your list of labeled assumptions.
Sources: USACE, Missouri River Mainstem Reservoir System, Summary of Actual 2012 Regulation (archived copy) (webarchive.library.unt.edu); NOAA NCEI, Climate at a Glance: Missouri statewide time series (ncei.noaa.gov); Dieter and others, 2018, USGS county-level water-use data for 2015 (sciencebase.gov); Missouri DNR, Southeastern Lowlands Groundwater Province (PUB3001) (dnr.mo.gov); Richards, J.M., 2010, USGS SIR 2010-5227 (pubs.usgs.gov); Missouri DNR, Major Water Users (dnr.mo.gov); Heath, R. C., Basic Ground-Water Hydrology, USGS WSP 2220 (pubs.usgs.gov)