construct an explanation, from historical and physical evidence, of how the availability of water has shaped settlement and farming in Missouri’s Bootheel and around Springfield, and argue about how groundwater should be managed.
Instruction
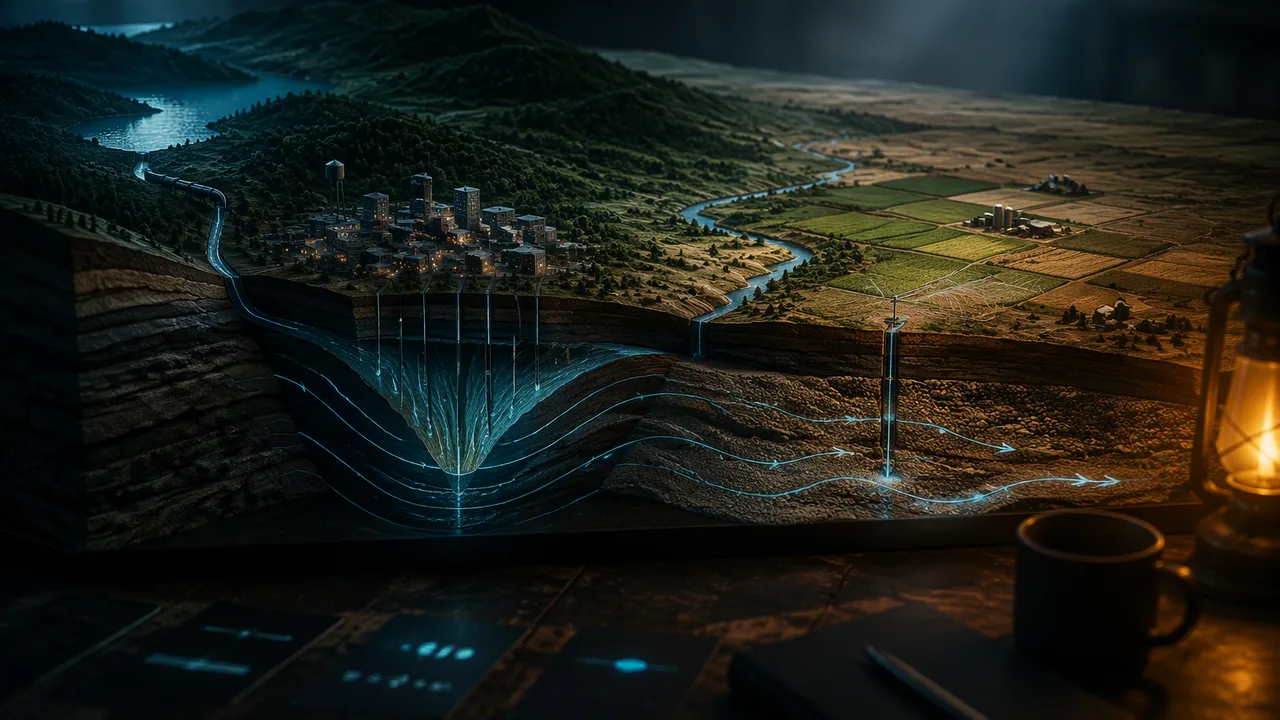
Water made the Bootheel. Missouri’s far southeastern corner, the Bootheel, sits on a broad, flat plain of sand and gravel laid down by the Mississippi and Ohio rivers. The Missouri Department of Natural Resources (MDNR) calls it the state’s most agriculturally productive region, with most of its water used for irrigation. That water comes from the ground. The Southeast Lowlands alluvial aquifer lies right at the surface, holds up to about 21 trillion gallons, and supports irrigation wells that can pump up to 3,000 gallons per minute. In 2015 eight southeastern counties, the Bootheel and its neighbors, pumped about 1,155 million gallons of groundwater a day for irrigation: 89% of all the groundwater irrigation in Missouri, watering 84% of the state’s irrigated acres. Irrigated farms, and the towns and jobs that serve them, grew where that water could be reached. This is a clear case of the availability of a natural resource shaping where and how people live.
Water made, and nearly unmade, a city. Springfield grew on the Ozark aquifer, a sequence of dolomite and sandstone more than 900 feet thick. As the city and its neighbors pumped more, the water level in the aquifer fell fastest under the city, forming a cone of depression. USGS and state studies traced it: by 1974 the water level at its center was nearly 300 feet below its level before pumping began; by 1987, 350 feet; by 1996, about 500 feet. In the late 1980s Springfield began building a pump station and a 30-mile pipeline from Stockton Lake, completed in 1996, to rely less on wells. The nearby towns of Nixa, Ozark and Republic, which grew fast in the 1990s, still depend entirely on groundwater.
How a cone of depression forms. When a well pumps, water flows toward it from the surrounding aquifer, and the water table slopes down toward the well like a funnel. The faster the pumping and the lower the aquifer’s permeability, the deeper and wider the cone. Where several large wells pump at once, their cones overlap and the water table drops further. MDNR warns that this is exactly how a Bootheel household’s shallow well can go dry in midsummer while the deep irrigation well next door keeps running. When the pumps stop, water flows back in and the water table recovers, if recharge from rain and rivers is large enough. In the Bootheel it usually is: rain, seepage from the Mississippi River and upward flow from the Ozark aquifer below refill it each winter. Under Springfield, in thick rock with slow recharge, it was not, and the cone grew for decades.
The drought year. In a monitoring well near Malden, in Dunklin County, the depth to water was 12.53 feet below the land surface on March 13, 2012 and 19.19 feet on September 11, 2012, a drop of 6.66 feet in six months of a hot, dry growing season. By August 2013, after a wetter year, it was back to 12.97 feet. Under Missouri law, anyone able to pump 100,000 gallons a day or more (about 70 gallons a minute) is a major water user who must register with MDNR and report water use every year, so that the state can plan for droughts. MDNR’s 2020 Missouri Water Resources Plan found that water demands in some areas of the state cannot be met long term, especially under drought conditions.
Worked example: rates from data. Under Springfield the water level fell about 50 feet between 1974 and 1987, 50 / 13 ≈ 3.8 feet per year, and about 150 feet between 1987 and 1996, 150 / 9 ≈ 16.7 feet per year. A rate that speeds up while a city grows is strong evidence that pumping, not a natural change, drives the decline. At Malden, 6.66 feet in about 6 months is roughly 1.1 feet per month, but the water came back the next year: a seasonal drawdown, not a long-term decline.
Your argument. Choose a question: Should Missouri limit groundwater pumping in a drought, even if crops are lost? Are falling water levels mainly a result of drought or of human choices? A strong argument names the evidence, explains the mechanism and treats the people affected, farm families, farmworkers, rural households on shallow wells and city water customers, with respect.
📖 Read for this lesson
The reading opens over the lesson; close it to come back to exactly where you were. The checks below draw on it.
Lab: Drawing Down an Aquifer: A Cone-of-Depression Model
Question. How does pumping one well change the water table around it, and does the water table recover when pumping stops?
Materials
- A clear plastic storage box or food container at least 25 cm long
- Play sand, enough to fill the container about 8 cm deep
- A paper or plastic cup with many small holes punched in its sides and bottom (the pumping well)
- A second small cup with holes, cut down so it is only 3 cm tall (a neighbor’s shallow well)
- A turkey baster, large syringe or small cup for removing water
- A measuring cup, a ruler with mm marks, masking tape and a marker
- A tray or towel to catch spills
- Wear safety goggles; wet sand can splash.
- Keep water on the tray and wipe up spills at once to prevent slips; pour used sand into the trash or garden, never down a drain.
Procedure
- Push the pumping-well cup into the sand at one end of the container so its rim is just above the sand. Press the shallow-well cup into the sand 8 cm away so its bottom sits 45 mm above the container floor. Tape a strip of masking tape along the outside wall and mark 3, 8, 15 and 25 cm from the pumping well.
- Slowly add water until the water table, the line where the sand turns dark and saturated, is 60 mm above the container floor everywhere. Wait 2 minutes and measure the water-table height through the clear wall at each mark.
- Pumping: remove 50 mL of water from inside the pumping well every 30 seconds for 3 minutes, pouring it into the measuring cup. Measure the water-table height at each mark immediately afterward. Note whether any water remains in the shallow well.
- Recovery: stop pumping. Measure the water-table height at each mark after 5 minutes and again after 10 minutes.
- Pour the pumped water back in gently at the far end, then compute the drawdown (starting height minus pumped height) at each distance and sketch the shape of the water table.
Data
| Stage | 3 cm from well (mm) | 8 cm (mm) | 15 cm (mm) | 25 cm (mm) | Water in shallow well? |
|---|---|---|---|---|---|
| Before pumping | |||||
| After 3 minutes of pumping | |||||
| 5 minutes after pumping stopped | |||||
| 10 minutes after pumping stopped |
Illustrative model measurements (Option B). One sand-box model, water-table height above the container floor in millimeters. Constructed teaching numbers, not real measurements. The shallow well’s bottom is at 45 mm.
| Stage | 3 cm (mm) | 8 cm (mm) | 15 cm (mm) | 25 cm (mm) | Water in shallow well? |
|---|---|---|---|---|---|
| Before pumping | 60 | 60 | 60 | 60 | yes |
| After 3 minutes of pumping | 28 | 41 | 50 | 56 | no |
| 5 minutes after pumping stopped | 52 | 55 | 57 | 59 | yes |
| 10 minutes after pumping stopped | 59 | 59 | 60 | 60 | yes |
Real monitoring-well record (Option B). Depth to water below the land surface, in feet, in a state-monitored well in the Bootheel alluvial aquifer near Malden, Dunklin County (USGS site 362955089581801, measured by the Missouri Department of Natural Resources). A larger depth means a lower water table.
| Date | May 11, 2010 | Sep 8, 2010 | Mar 13, 2012 | Sep 11, 2012 | Feb 26, 2013 | Aug 20, 2013 | Feb 25, 2014 | Aug 4, 2014 |
|---|---|---|---|---|---|---|---|---|
| Depth to water (ft) | 11.33 | 16.90 | 12.53 | 19.19 | 16.66 | 12.97 | 13.02 | 12.87 |
Analysis
- Claim: does pumping create a cone of depression in your model? Use the drawdown at each distance as evidence and explain why the water table is lowest next to the well.
- Explain why the shallow well went dry while the pumping well still held water. What does this suggest about who is affected first when big wells run in a drought?
- Scale: from the Malden record, compute the drawdown from March to September 2012 and its rate in feet per month, then compare the same season in 2014. Name one way your sand box differs from a real aquifer.
- Sources of error: how do reading a wet, uneven water line through the wall and removing water at an uneven pace affect your data?
If you cannot do this lab in person: Choose one. All three earn full credit and end in the same claim about pumping and the cone of depression, the same comparison of a drought season with a wetter one and the same rate calculation. Option A — build the model. The procedure above. A clear food container, play sand, two cups with holes punched in them, a turkey baster or cup, and a ruler are everything you need. Option B — the measurements in the data section above. No materials and no internet. Use the illustrative sand-box table for the mechanism (how drawdown changes with distance, why the shallow well went dry, how fast the water table recovered), and the real Malden record for the rates: compute the drawdown in feet and the rate in feet per month for the 2010, 2012 and 2014 growing seasons, and say what the comparison is evidence for. Check yourself against the lesson’s worked example, which gives 6.66 feet for 2012. Option C — the public record. Use this lesson’s hosted reading, which prints the USGS and MDNR water-level records for three Bootheel wells and the measured growth of the Springfield cone of depression. Record the measurements and dates it gives, compute rates for at least two different periods, and compare a drought period with a wetter one. Do not round a number the table does not give; cite the reading and the USGS or MDNR source it names.
Formative check
Work through these before moving on. They are not graded — they tell you whether the standard below has landed yet.
Why can a shallow household well go dry in midsummer while a deep irrigation well nearby keeps pumping?
Under Springfield the water level in the Ozark aquifer fell from about 350 feet below its predevelopment level in 1987 to about 500 feet below it in 1996, an average of about feet per year over those years.
In Missouri, anyone able to withdraw 100,000 gallons of water a day or more must register with the Department of Natural Resources and report water use each year.
Write a CER argument on one question: ‘Should Missouri limit groundwater pumping in drought years even if some crops are lost?’ or ‘Are falling water levels mainly caused by drought or by human choices?’ Use at least two pieces of evidence (your model data, the Malden record, the Springfield cone of depression, the 2012 rainfall) and explain the mechanism. Name who bears the costs of each choice. Then write the strongest objection a person affected (a Bootheel farmer, a household on a shallow well, or a Springfield water planner) might raise, and answer it in writing or on a recording.
How confident are you that you can explain with evidence how water availability has shaped settlement in Missouri and argue about groundwater management?
Practice
Work these on paper or in your notebook, then open Check your answer. Aim for all of Fluency and Application; try at least one Challenge.
Printable version: this unit’s practice workbook (PDF)
Fluency
Build speed and accuracy with the core skill.
- Under Springfield the water level in the Ozark aquifer was about 350 feet below its predevelopment level in 1987 and about 500 feet below it in 1996. What was the average rate of decline in feet per year?
Check your answer
Answer: about 16.7 ft/yr - The same water level was nearly 300 feet below predevelopment in 1974 and 350 feet below in 1987. What was the average rate of decline in feet per year?
Check your answer
Answer: about 3.8 ft/yr - In a Bootheel monitoring well near Malden, the depth to water was 12.53 ft on March 13, 2012 and 19.19 ft on September 11, 2012. How far did the water table drop, and about how fast in feet per month?
Check your answer
Answer: 6.66 ft, about 1.1 ft per month
Application
Use the skill in context. Show your reasoning.
- The water table falls 2 m under 1 km2 of Bootheel farmland, in sand with a specific yield of 0.20. How much water was removed from storage, in m3 and acre-feet?
Check your answer
Answer: 400,000 m3, about 324 acre-feetVolume = area × drop × specific yield = 1,000,000 × 2 × 0.20; divide by 1,233.48 m3 per acre-foot. - In the sand-box model the water table next to the pumping well fell from 60 mm to 28 mm, then rose to 52 mm five minutes after pumping stopped. What was the drawdown, and what percentage of it had recovered after five minutes?
Check your answer
Answer: 32 mm of drawdown; 24 mm, or 75%, had recovered - Give two ways the availability of groundwater has shaped where and how people live in Missouri.
Check your answer
Answer: The Bootheel’s alluvial aquifer made large-scale irrigated farming possible, so farms, towns and jobs grew there (in 2015 eight southeastern counties held 84% of Missouri’s irrigated acres); around Springfield, the city grew on Ozark-aquifer wells until the falling water level pushed it to build a 30-mile pipeline from Stockton Lake, while nearby towns still rely entirely on wells.
Challenge
Stretch problems. Expect to think before you write.
- A household well near Malden has its pump intake 18 ft below the ground. Using the Malden record (12.53 ft in March 2012, 19.19 ft in September 2012, 12.97 ft in August 2013), when was the water table below the intake, and why would the deeper irrigation wells nearby keep working?
Check your answer
Answer: In September 2012, when the water was 19.19 ft down, 1.19 ft below the intake; the irrigation wells reach much deeper into the aquifer, so their intakes stay below the lowered water table even inside the cone of depression.
Review
Keep earlier skills sharp.
- Compare a magnitude 7.5 earthquake with a magnitude 6.0 earthquake. About how many times larger is the ground-motion amplitude, and about how many times more energy is released?
Check your answer
Answer: amplitude ≈ 31.6 times; energy ≈ 178 timesEach whole step in magnitude is 10 times the amplitude and about 32 times (101.5) the energy.
Six Feet in a Summer, Five Hundred in a Century: Water Levels in the Bootheel and Under Springfield
USGS Water Data field measurements (depth to water, parameter 72019) for MDNR monitoring wells 362955089581801, 365319089331001 and 360425089485001; Richards, USGS SIR 2010-5227; Missouri DNR PUB3001 and Major Water Users page; retrieved November 6, 2026 · Public domain (works of the United States government and Missouri state agencies), with SLS original arithmetic
Why this reading. Your argument needs measured evidence, and Option C sends you to the public record for it. The records are here, with the agency and site number for each, so you can compute rates for two periods, compare a drought season with a wetter one, and cite what you used. Two very different Missouri aquifers are included: the Bootheel’s shallow alluvial aquifer, where pumping makes the water table fall every summer and rise every winter, and the deep Ozark aquifer under Springfield, where it fell for most of a century.
Table 1. Bootheel alluvial aquifer: depth to water in three monitoring wells, feet below land surface
The Missouri Department of Natural Resources (MDNR) measures these wells, usually in late winter before irrigation starts and in late summer near the end of it, and the USGS publishes the results (USGS Water Data field measurements, parameter 72019; measuring agency code MO005). All three wells are open to the Mississippi River Valley alluvial aquifer. A larger number means a lower water table.
Malden (Dunklin County), USGS site 362955089581801, well depth 108 ft
| Date | 2010-01-21 | 2010-05-11 | 2010-09-08 | 2011-01-27 | 2011-07-25 | 2012-03-13 | 2012-07-26 | 2012-09-11 | 2013-02-26 | 2013-08-20 | 2014-02-25 | 2014-08-04 | 2014-08-12 |
|---|---|---|---|---|---|---|---|---|---|---|---|---|---|
| Depth to water (ft) | 11.91 | 11.33 | 16.90 | 18.39 | 13.61 | 12.53 | 18.22 | 19.19 | 16.66 | 12.97 | 13.02 | 12.87 | 13.13 |
Sikeston (Scott County), USGS site 365319089331001, well depth 146 ft
| Date | 2010-01-20 | 2010-05-10 | 2010-09-08 | 2011-01-26 | 2011-04-11 | 2011-07-11 | 2011-09-26 | 2011-12-13 | 2012-03-14 | 2012-07-24 | 2012-07-25 | 2012-07-30 | 2012-09-19 | 2012-11-29 | 2013-02-27 | 2013-08-19 | 2013-08-21 | 2014-02-24 | 2014-08-05 | 2014-08-13 |
|---|---|---|---|---|---|---|---|---|---|---|---|---|---|---|---|---|---|---|---|---|
| Depth to water (ft) | 6.81 | 6.10 | 8.65 | 8.25 | 6.12 | 7.06 | 8.12 | 5.33 | 6.49 | 8.73 | 8.76 | 8.73 | 8.57 | 7.71 | 6.29 | 7.28 | 7.36 | 6.70 | 7.82 | 7.74 |
Steele (Pemiscot County), USGS site 360425089485001
| Date | 2010-01-20 | 2010-02-01 | 2010-05-11 | 2010-09-08 | 2011-01-26 | 2011-04-11 | 2011-07-11 | 2011-08-10 | 2011-12-13 | 2012-03-13 | 2012-07-25 | 2012-09-10 | 2013-02-26 | 2013-08-20 | 2013-08-21 | 2014-02-25 | 2014-08-04 | 2014-08-12 |
|---|---|---|---|---|---|---|---|---|---|---|---|---|---|---|---|---|---|---|
| Depth to water (ft) | 12.59 | 11.95 | 11.82 | 16.33 | 17.46 | 14.73 | 13.75 | 15.15 | 12.83 | 12.72 | 16.57 | 17.45 | 14.74 | 13.73 | 13.78 | 13.59 | 13.81 | 13.13 |
Worked from Table 1
- Malden, 2012: March 13 to September 11, 19.19 − 12.53 = 6.66 ft of drawdown in about 6 months, 1.11 ft per month (lesson: 6.66 ft, about 1.1 ft per month). By February 26, 2013 the water had risen 2.53 ft, and by August 20, 2013, in a wetter summer, it stood at 12.97 ft, 3.69 ft higher than in February.
- Malden, 2010: May 11 to September 8, 16.90 − 11.33 = 5.57 ft in about 4 months, 1.39 ft per month.
- Malden, 2014: February 25 to August 4, 12.87 − 13.02 = -0.15 ft: essentially no summer drawdown.
- The long view: the Malden well read 13.05 ft on October 21, 1975 and 15.12 ft on June 23, 2026; Sikeston read 7.7 ft in April 1976 and 8.53 ft in June 2026. Over fifty years the Bootheel water table has moved up and down with the seasons and the weather, not steadily downward, which is what MDNR means when it says the water table “remains at relatively stable levels” thanks to rain, seepage from the Mississippi River and upward flow from the Ozark aquifer below.
Table 2. The cone of depression under Springfield, Ozark aquifer
Water-level decline at the center of the cone, measured from the level before large-scale pumping began, as summarized by the USGS (Richards, 2010, Scientific Investigations Report 2010-5227) from the earlier studies it cites.
| Year | Decline from predevelopment level | Study cited by USGS |
|---|---|---|
| late 1930s | cone already present | Steinkamp (1987) |
| 1974 | nearly 300 ft | Emmett and others (1978) |
| 1987 | 350 ft, cone expanding | Imes (1989) |
| 1996 | about 500 ft | Miller and Vandike (1997) |
Rates: 1974-1987, 50 / 13 = 3.8 ft per year; 1987-1996, 150 / 9 = 16.7 ft per year (lesson: 3.8 and 16.7). USGS also reports that pumping in its Greene County model area rose from 1,093,268 cubic feet per day in 1962 to 2,693,423 in 1987 and 4,330,177 in 2006, that Springfield completed a pump station and a 30-mile pipeline from Stockton Lake to Fellows Lake in 1996 to reduce its dependence on groundwater, and that the fast-growing nearby cities of Nixa, Ozark and Republic, whose populations grew 158%, 128% and 34% from 1990 to 2000, remain entirely dependent on groundwater. Even in 1996, about 1,067 ft of the Ozark aquifer remained saturated at the lowest point of the cone: the problem was never running out of rock, but the cost of lifting water from ever deeper and the wells that stopped reaching it.
What the two records say together
Both records show pumping lowering water levels. The difference is recharge. The Bootheel aquifer is sand and gravel at the surface beside a great river, so it refills each winter, and its harm is seasonal: MDNR notes that the cone of depression around a high-capacity well, deepened where several pump at once, can leave nearby shallow household wells dry until the pumps stop. The Ozark aquifer under Springfield is deep rock beneath a confining layer, so pumping drew water out faster than it came back, year after year, until the city changed its source. That contrast is the core of the lesson’s second question: drought set the timing at Malden in 2012, but human choices, how much to pump and from where, set the size and the duration.
The law that applies
Under sections 256.400 to 256.433 RSMo, a major water user, any person or entity able to produce 100,000 gallons a day (about 70 gallons per minute) from wells or surface intakes, must register once with MDNR and report water use every year, with no fee. MDNR uses the reports to plan for droughts. Its 2020 Missouri Water Resources Plan, required by section 640.415 RSMo, concluded that water demands in certain areas of the state cannot be met long term, especially under drought conditions.
Sources: USGS Water Data API, field measurements, well 362955089581801 (Malden) (api.waterdata.usgs.gov); USGS Water Data API, field measurements, well 365319089331001 (Sikeston) (api.waterdata.usgs.gov); USGS Water Data API, field measurements, well 360425089485001 (Steele) (api.waterdata.usgs.gov); Richards, J.M., 2010, USGS Scientific Investigations Report 2010-5227 (Greene County, Missouri) (pubs.usgs.gov); Missouri DNR, Southeastern Lowlands Groundwater Province (PUB3001) (dnr.mo.gov); Missouri DNR, Major Water Users (dnr.mo.gov); Missouri DNR, Missouri Water Resources Plan (dnr.mo.gov)