build a year-by-year computational model of a groundwater basin and use it to compare how different management strategies affect sustainability.
Instruction
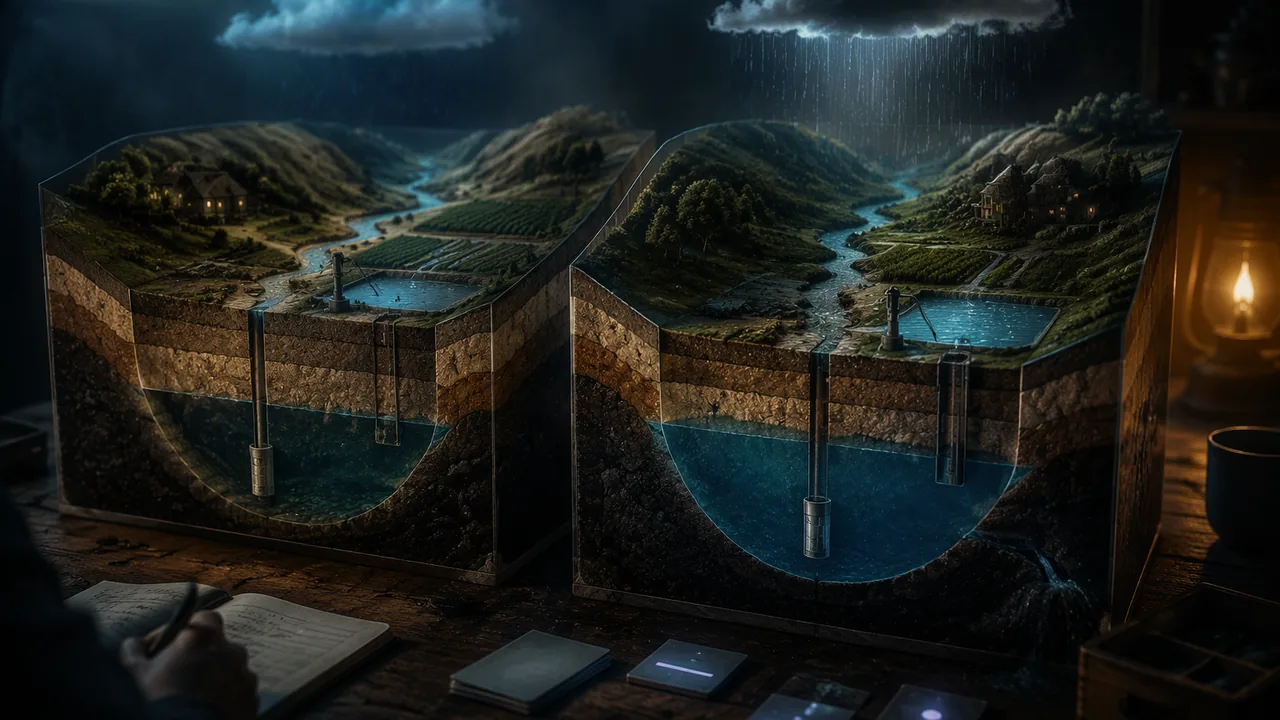
A basin as a bathtub. A groundwater basin can be modeled like a bathtub with a tap and a drain. The tap is recharge: rain soaking in, river and canal seepage, and water deliberately spread on fields to sink in. The drain is discharge: pumping, plus natural outflow to rivers and springs. The water in the tub is storage. Conservation of matter gives the model’s one rule:
storage next year = storage this year + recharge − pumping − natural outflow
This is a stock-and-flow model, and it is the core of the computer models water agencies use, which divide a basin into thousands of cells and run the same rule in each.
Worked example (an illustrative basin). A basin has 2,000,000 acre-feet of usable storage. Average recharge is 400,000 acre-feet per year and pumping is 550,000; ignore natural outflow. Each year storage changes by 400,000 − 550,000 = −150,000 acre-feet. After 1 year: 1,850,000; after 5 years: 1,250,000. At this rate the usable storage is gone in 2,000,000 / 150,000 ≈ 13.3 years. To balance the budget, pumping must fall to 400,000, a cut of 150,000 / 550,000 ≈ 27%. A 15% cut (pumping 467,500) still leaves an overdraft of 67,500 acre-feet a year: slower decline, but still decline.
Adding reality. A useful model includes what matters and leaves out what does not. Three improvements make this one more realistic:
- Wet and dry years. Replace average recharge with a sequence, for example two wet years at 700,000, then three dry years at 200,000. Droughts matter because pumping rises exactly when recharge falls.
- A dry-well rule. When storage drops below a threshold, shallow household wells go dry and springs and streams fed by the aquifer lose flow. Count the years the basin spends below the threshold.
- Managed recharge. In wet years, flood water can be spread on fields or basins to sink in. Adding 100,000 acre-feet in each wet year is one strategy to test.
Sustainability. A basin is managed sustainably when, averaged over wet and dry years, storage stops falling and harms such as dry wells and dried-up springs are avoided. The model lets you compare strategies before trying them on a real aquifer, which is exactly what engineers do with a computer simulation: define the criteria (storage stable by a target year), the constraints (farm jobs, drinking water for every household, river flows for fish), and then test solutions against them.
Limits. Every model simplifies. This one treats the basin as one well-mixed tub; a real basin has areas where water tables fall fast and others where they barely move, as the cone of depression under Springfield shows. Say what your model leaves out and how that might change your conclusion.
📖 Read for this lesson
The reading opens over the lesson; close it to come back to exactly where you were. The checks below draw on it.
Formative check
Work through these before moving on. They are not graded — they tell you whether the standard below has landed yet.
Simulation & tools
A basin model in a few lines of Python
Open JupyterLite and start a Python notebook. Type and run:
storage = 2000000
for year in range(1, 21):
    recharge = 400000
    pumping = 550000
    storage = storage + recharge - pumping
    print(year, storage)
Record the year storage first falls below zero. Then make three changes, one at a time, and record the storage after 20 years for each: (1) cut pumping by 15%; (2) cut pumping by 150,000, to 400,000 (about 27%); (3) use recharge of 700,000 in years 1-2, 6-7, 11-12 and 16-17 and 200,000 in all other years, with the original pumping. Which strategy meets the criterion ‘storage no lower in year 20 than in year 1’?
No device? Build the same table by hand for 10 years, one row per year, and extend the pattern.
Open JupyterLite ↗ · JupyterLite, Project Jupyter · BSD-3-Clause
A basin holds 900,000 acre-feet. Recharge is 250,000 per year and pumping is 310,000. How much is left after 5 years?
If average recharge equals average pumping, the basin can still lose storage during a long drought.
Design one management strategy for the model basin (a pumping cut, managed recharge in wet years, or a combination). State one criterion and two constraints. Run it for 20 years with the wet-dry recharge sequence, graph storage against year, and explain whether it meets your criterion and what it costs.
How confident are you that you can build a computational model of a groundwater basin and use it to compare management strategies?
Practice
Work these on paper or in your notebook, then open Check your answer. Aim for all of Fluency and Application; try at least one Challenge.
Printable version: this unit’s practice workbook (PDF)
Fluency
Build speed and accuracy with the core skill.
- A basin holds 2,000,000 acre-feet. Recharge is 400,000 and pumping 550,000 acre-feet per year. What is the storage after 3 years?
Check your answer
Answer: 1,550,000 acre-feet - For the same basin, how many years until the usable storage is gone?
Check your answer
Answer: about 13.3 years - What percentage cut in pumping from 550,000 would balance recharge of 400,000?
Check your answer
Answer: about 27%
Application
Use the skill in context. Show your reasoning.
- Recharge follows a 5-year cycle: 700,000 acre-feet in each of 2 wet years and 200,000 in each of 3 dry years. What is the average recharge, and what pumping rate would be sustainable on average?
Check your answer
Answer: average 400,000 acre-feet per year; sustainable pumping about 400,000(2 × 700,000 + 3 × 200,000) / 5. - With pumping at 550,000 and the 5-year cycle above, how much storage is lost over one full cycle? Over 20 years?
Check your answer
Answer: 750,000 acre-feet per cycle; 3,000,000 over 20 years - A district adds managed recharge of 100,000 acre-feet in each wet year and cuts pumping by 15%. What is the average yearly change in storage?
Check your answer
Answer: -27,500 acre-feet per yearAverage recharge 400,000 + 40,000; pumping 467,500.
Challenge
Stretch problems. Expect to think before you write.
- In the dry years, farmers pump 650,000 instead of 550,000 (and 450,000 in wet years). With the 5-year recharge cycle, what is the average yearly change in storage, and what does this show about droughts?
Check your answer
Answer: -170,000 acre-feet per yearCycle recharge 2,000,000; cycle pumping 2 × 450,000 + 3 × 650,000 = 2,850,000; divide the difference by 5. Pumping rises when recharge falls, deepening the overdraft.
Review
Keep earlier skills sharp.
- A sample has mass 150.0 g and volume 150.0 cm3. Find its density and, using a density table, suggest what it could be.
Check your answer
Answer: 1.00 g/cm3, consistent with water (1.0 g/cm3)Density = mass / volume. - Review (Semester A): a stream 6 m wide and 0.5 m deep flows at 1.0 m/s. What is its discharge?
Check your answer
Answer: 3 m3/s
Eight Runs of the Basin: The Stock-and-Flow Model, Year by Year
SLS original model runs of the lesson’s illustrative basin; groundwater-model context from USGS SIR 2010-5227 (Richards, 2010), retrieved November 6, 2026 · SLS original
Why this reading. The workshop asks you to run a stock-and-flow model of a groundwater basin for twenty years under several strategies and judge them against a criterion. Here is every run, year by year, so that a paper model can be checked line by line and a notebook can be checked against a known answer before you trust it on a strategy of your own. The basin is the lesson’s illustrative one; the arithmetic is exact.
The rule and the sequence
Storagenext = storage + recharge − pumping, starting at 2,000,000 acre-feet with natural outflow ignored. The wet-dry sequence is the one the lesson specifies: recharge 700,000 AF in years 1–2, 6–7, 11–12 and 16–17, and 200,000 AF in every other year. Its average is (2 × 700,000 + 3 × 200,000)/5 = 400,000 AF, the same as the steady case, which is the point of running both. Managed recharge adds 100,000 AF in each wet year. A 15% cut makes pumping 467,500 AF; the balancing cut of 150,000 AF makes it 400,000 AF, a cut of 150,000/550,000 = 27.3%.
Table 1. Storage at the end of each year, thousands of acre-feet
| Scenario | 0 | 1 | 2 | 3 | 4 | 5 | 6 | 7 | 8 | 9 | 10 | 11 | 12 | 13 | 14 | 15 | 16 | 17 | 18 | 19 | 20 |
|---|---|---|---|---|---|---|---|---|---|---|---|---|---|---|---|---|---|---|---|---|---|
| A. Average recharge 400,000; pumping 550,000 | 2,000 | 1,850 | 1,700 | 1,550 | 1,400 | 1,250 | 1,100 | 950 | 800 | 650 | 500 | 350 | 200 | 50 | -100 | -250 | -400 | -550 | -700 | -850 | -1,000 |
| B. 15% pumping cut (467,500) | 2,000 | 1,932.5 | 1,865 | 1,797.5 | 1,730 | 1,662.5 | 1,595 | 1,527.5 | 1,460 | 1,392.5 | 1,325 | 1,257.5 | 1,190 | 1,122.5 | 1,055 | 987.5 | 920 | 852.5 | 785 | 717.5 | 650 |
| C. Balancing cut of 150,000, about 27% (pumping 400,000) | 2,000 | 2,000 | 2,000 | 2,000 | 2,000 | 2,000 | 2,000 | 2,000 | 2,000 | 2,000 | 2,000 | 2,000 | 2,000 | 2,000 | 2,000 | 2,000 | 2,000 | 2,000 | 2,000 | 2,000 | 2,000 |
| D. Wet-dry recharge, pumping 550,000 | 2,000 | 2,150 | 2,300 | 1,950 | 1,600 | 1,250 | 1,400 | 1,550 | 1,200 | 850 | 500 | 650 | 800 | 450 | 100 | -250 | -100 | 50 | -300 | -650 | -1,000 |
| E. Wet-dry recharge, 15% cut | 2,000 | 2,232.5 | 2,465 | 2,197.5 | 1,930 | 1,662.5 | 1,895 | 2,127.5 | 1,860 | 1,592.5 | 1,325 | 1,557.5 | 1,790 | 1,522.5 | 1,255 | 987.5 | 1,220 | 1,452.5 | 1,185 | 917.5 | 650 |
| F. Wet-dry recharge, 15% cut, +100,000 AF managed recharge in wet years | 2,000 | 2,332.5 | 2,665 | 2,397.5 | 2,130 | 1,862.5 | 2,195 | 2,527.5 | 2,260 | 1,992.5 | 1,725 | 2,057.5 | 2,390 | 2,122.5 | 1,855 | 1,587.5 | 1,920 | 2,252.5 | 1,985 | 1,717.5 | 1,450 |
| G. Wet-dry recharge, balancing cut (pumping 400,000) | 2,000 | 2,300 | 2,600 | 2,400 | 2,200 | 2,000 | 2,300 | 2,600 | 2,400 | 2,200 | 2,000 | 2,300 | 2,600 | 2,400 | 2,200 | 2,000 | 2,300 | 2,600 | 2,400 | 2,200 | 2,000 |
| H. Wet-dry recharge, +100,000 AF managed recharge only | 2,000 | 2,250 | 2,500 | 2,150 | 1,800 | 1,450 | 1,700 | 1,950 | 1,600 | 1,250 | 900 | 1,150 | 1,400 | 1,050 | 700 | 350 | 600 | 850 | 500 | 150 | -200 |
Table 2. The criterion, applied
The lesson’s criterion is “storage no lower in year 20 than in year 1.” Two other things worth reading off each run: the lowest storage reached (dry wells and dried-up springs happen at the low point, not at the average) and the net change from year 1 to year 20.
| Scenario | Year 1 | Year 20 | Change | Meets criterion? | Lowest point (year) |
|---|---|---|---|---|---|
| A. Average recharge 400,000; pumping 550,000 | 1,850 | -1,000 | -2,850 | no | -1,000 (20) |
| B. 15% pumping cut (467,500) | 1,932.5 | 650 | -1,282.5 | no | 650 (20) |
| C. Balancing cut of 150,000, about 27% (pumping 400,000) | 2,000 | 2,000 | 0 | yes | 2,000 (1) |
| D. Wet-dry recharge, pumping 550,000 | 2,150 | -1,000 | -3,150 | no | -1,000 (20) |
| E. Wet-dry recharge, 15% cut | 2,232.5 | 650 | -1,582.5 | no | 650 (20) |
| F. Wet-dry recharge, 15% cut, +100,000 AF managed recharge in wet years | 2,332.5 | 1,450 | -882.5 | no | 1,450 (20) |
| G. Wet-dry recharge, balancing cut (pumping 400,000) | 2,300 | 2,000 | -300 | no | 2,000 (5) |
| H. Wet-dry recharge, +100,000 AF managed recharge only | 2,250 | -200 | -2,450 | no | -200 (20) |
Reading the runs
- A loses 150,000 AF every year and goes negative in year 14: 2,000,000 / 150,000 = 13.3 years, so year 14 is the first with nothing left. The lesson’s “13.3 years” is this number.
- B, the 15% cut, still loses 67,500 AF a year and ends at 650,000 AF. Slower is not sustainable.
- C, the balancing cut, holds storage at exactly 2,000,000 AF every year. It is the only steady run that meets the criterion. If you cut by a rounded 27% (pumping 401,500) instead, storage falls by 1,500 AF a year and ends at 1,970,000 AF, which misses the criterion by 28,500 AF: round the percentage after you compute the pumping, not before.
- D has the same average recharge as A and ends in the same place, -1,000,000 AF, but by a different road: it rises to 2,300,000 in year 2 and then loses 350,000 a year through every three-year dry spell. Averages hide the years that hurt.
- H, managed recharge alone, adds 200,000 AF every five years, or 40,000 a year on average, against a 150,000 overdraft, so it still falls by about 110,000 a year and ends 2,200,000 AF below where it started. Lesson 1.5 quotes this 110,000.
- F, the 15% cut with managed recharge, is the lesson’s “close, but not yet sustainable”: 67,500 − 40,000 = 27,500 AF a year of deficit, 550,000 over twenty years, so it ends at 1,450,000 AF. Its lowest point, 1,450,000 in year 20, is far above D’s, which is why combinations are worth modeling even when they miss the criterion.
- G is the balancing cut under the wet-dry sequence. It ends at 2,000,000, exactly where it started in year 0, but year 1 is a wet year (2,300,000), so by the letter of the criterion it fails. That is a lesson about criteria: measured against year 0, or against the average of the first five years, it would pass. Say which baseline you use and why. On the way it swings between 2,000,000 and 2,600,000. A basin cannot store more than its capacity; if the tub holds only 2,000,000 AF, the surplus in wet years is lost unless someone builds a place to put it, which is what managed recharge is.
Checking your notebook
The lesson’s Python loop prints year and storage. For run A it should print 13 50000 and then 14 -100000. For the 15% cut, 20 650000; for the balancing cut, 20 2000000; for the wet-dry sequence, 2 2300000 and 20 -1000000. If your numbers differ, the most common cause is applying the cut to the wrong line or starting the wet years at year 0 instead of year 1.
What real aquifers look like
Water agencies run this same rule in models with thousands of cells. The USGS groundwater-flow model of the Ozark aquifer around Greene County, Missouri (Richards, 2010) divides about 2,870 square miles into 253 rows, 316 columns and 3 layers of cells 1,000 feet on a side, runs one step per year from 1907 to 2030, and sets recharge at 2.53 percent of each year’s precipitation. Even with pumping held at 2006 rates it projects a further decline of up to about 62 feet in Springfield by 2030; with population growth and a four-year drought, up to about 203 to 207 feet. That is this workshop’s rule, run in about 240,000 cells instead of one. Real aquifers also behave the way run D assumes and run A does not: pumping rises exactly when recharge falls, as the Malden well in the Lesson 1.3 reading shows for the summer of 2012. When you add a dry-well rule, choose a threshold storage and count the years below it; use the Lesson 1.3 reading’s well records to justify the threshold you pick.
Sources: Richards, J.M., 2010, Groundwater-flow model and effects of projected groundwater use in the Ozark Plateaus aquifer system in the vicinity of Greene County, Missouri, 1907-2030, USGS SIR 2010-5227 (pubs.usgs.gov)