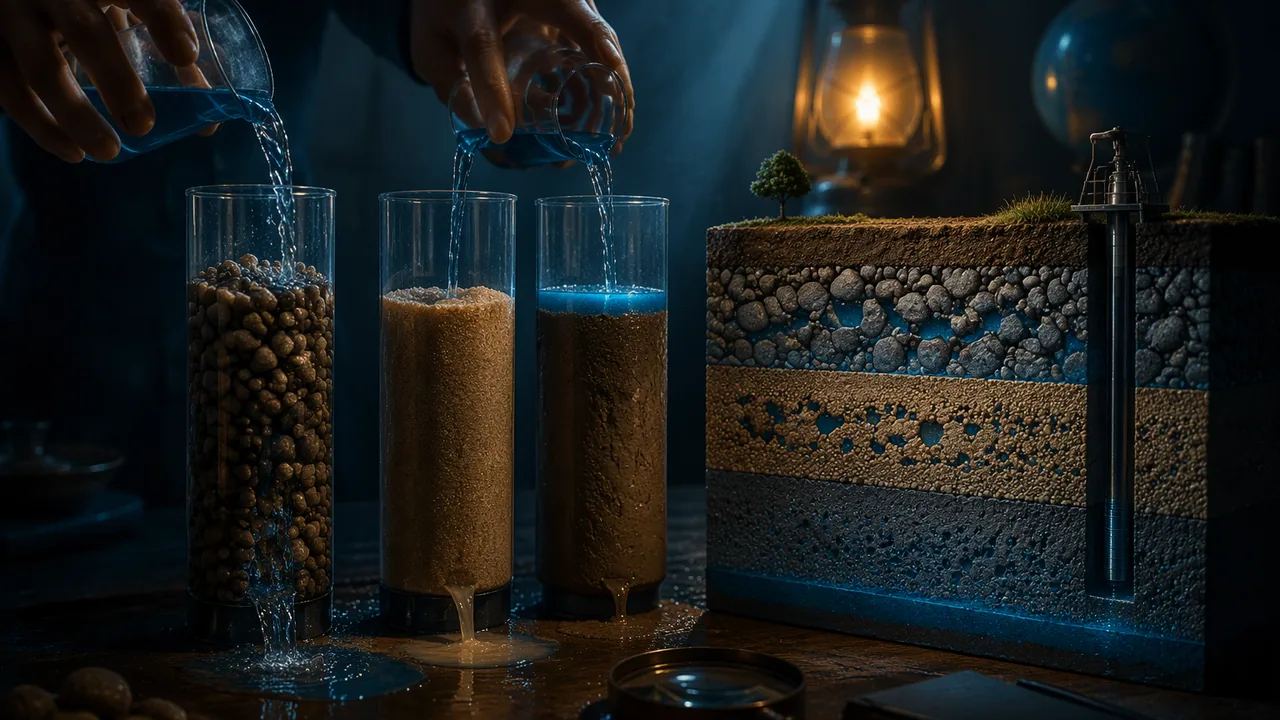
measure the porosity and permeability of gravel, sand and soil, and explain how the size and sorting of grains control how much water an aquifer stores and how fast water moves through it.
Instruction
Water underground. Groundwater is not an underground lake. It fills the tiny spaces between grains of sand and gravel and the cracks in rock, like water in a sponge. Below the water table every space is full: this is the saturated zone. A layer of rock or sediment that stores and transmits enough water to supply a well is an aquifer. In 2015, if you leave out the river water power plants borrow for cooling, about two-thirds (67%) of the water Missourians withdrew came from wells, and almost all irrigation water (95%) did.
Porosity: how much water fits. Porosity is the fraction of a material’s volume that is open space: porosity = pore volume / total volume. Worked example. A cup is filled to 100 mL with dry gravel. Water is poured in until it just reaches the top of the gravel, and 38 mL are needed. Porosity = 38 / 100 = 0.38, or 38%. Well-sorted sand and gravel usually have porosities of about 25-40%. Clay can have even higher porosity, 40-60%, because its tiny flat particles stack loosely. Solid granite, such as the granite of the St. Francois Mountains, may have less than 1%, except where it is fractured.
Permeability: how easily water moves. Permeability is how readily a material lets water flow through it. It depends on the size of the pores and how well they connect, not just on how many there are. Gravel has large, connected pores, so water pours through. Clay has high porosity but tiny pores in which water clings to the grains, so water barely moves: clay is nearly impermeable. Layers of clay and shale act as aquitards, confining the aquifers below them. Rock can surprise you: the Ozark aquifer under southern Missouri is mostly dolomite, a rock with little pore space between its grains, yet wells in it often yield 1,000 gallons per minute or more because groundwater has dissolved its fractures and bedding planes into connected channels. Those same channels feed the Ozarks’ springs, caves and losing streams.
Sorting matters. A well-sorted sediment has grains of similar size. A poorly sorted one mixes sizes, so small grains fill the spaces between large ones and both porosity and permeability drop. That is why river gravels, sorted by flowing water (Earth Science A, Unit 4), make some of the best aquifers.
How much water is that? Not all pore water drains out; some clings to grains. The fraction that drains is the specific yield. Suppose an aquifer under 1 km2 of farmland has a specific yield of 0.20 and the water table falls by 1 m. The water removed is 1,000,000 m2 × 1 m × 0.20 = 200,000 m3, or 200,000 / 1,233 ≈ 162 acre-feet. Under Springfield, decades of pumping lowered the water level in the Ozark aquifer by about 500 feet (150 m) by 1996, so the volumes can be enormous.
Your investigation. You will measure porosity by the volume of water a dry sample absorbs, and permeability by the time it takes water to drain through each sample. The key to a fair test is keeping the sample volume, the water volume and the container the same for every material, and repeating each measurement. Think about which material would make the best aquifer: the one that stores the most water, the one that lets water through fastest, or a balance of both?
📖 Read for this lesson
The reading opens over the lesson; close it to come back to exactly where you were. The checks below draw on it.
Lab: Measuring Porosity and Permeability of Aquifer Materials
Question. Which material, gravel, sand or soil, stores the most water, and which lets water flow through it fastest?
Materials
- Aquarium gravel, play sand and potting soil or clay-rich garden soil, about 300 mL of each, dry
- Three clear plastic cups and three cups with several small holes punched in the bottom
- A 100 mL graduated cylinder or measuring cup
- Water, a stopwatch and paper towels
- A tray to catch drips
- Wear safety goggles when pouring water onto soil and gravel, which can splash.
- Wipe up spilled water immediately so no one slips, and wash hands after handling soil.
Procedure
- Porosity: fill a solid cup to the 100 mL mark with dry gravel, tapping it gently to settle. Slowly pour water from the full graduated cylinder into the gravel until the water just reaches the top surface. Record the volume of water added.
- Repeat the porosity measurement for sand and for soil, using the same 100 mL volume. Repeat each material twice with fresh dry samples.
- Permeability: fill a holed cup with 100 mL of each dry material and hold it over an empty cup. Pour 100 mL of water onto the surface all at once and start the stopwatch.
- Stop the watch when water stops dripping steadily (no drip for 5 seconds). Record the drain time and the volume of water collected in the bottom cup.
- Compute porosity = water added / 100 mL, and the water retained = 100 mL − water collected. Graph porosity and drain time for the three materials.
Data
| Material | Water added to fill pores (mL), trial 1 | Trial 2 | Porosity (%) | Drain time (s) | Water collected (mL) | Water retained (mL) |
|---|---|---|---|---|---|---|
| Gravel | ||||||
| Sand | ||||||
| Soil |
Illustrative results (Option B). 100 mL of each dry material, 100 mL of water poured on all at once. Constructed teaching numbers, not real measurements; the porosity and retained-water columns are left for you.
| Material | Water added to fill the pores (mL), trial 1 | Trial 2 | Drain time (s) | Water collected below (mL) |
|---|---|---|---|---|
| Aquarium gravel | 41 | 39 | 6 | 92 |
| Play sand | 33 | 31 | 38 | 74 |
| Clay-rich garden soil | 47 | 45 | 315 | 31 |
Analysis
- Claim: which material would make the best aquifer for a town’s wells? Use both porosity and drain time as evidence, and explain your reasoning in terms of pore size and connection.
- Did the material with the highest porosity also drain fastest? Explain why porosity and permeability are different properties.
- Retained water is a model of the water that does not drain from an aquifer. Estimate the specific yield of your sand as water collected / 100 mL.
- Sources of error: how could trapped air, packing the samples differently and deciding when dripping ‘stops’ affect your results? How would you reduce each?
If you cannot do this lab in person: Choose one. All three earn full credit and end in the same porosity and drain-time comparison and the same recommendation for a town’s wells. Option A — the three geologic materials. The procedure above, with aquarium gravel, play sand and clay-rich soil. Paper cups with holes punched in the bottom and a kitchen measuring cup are all the apparatus needed. Option B — the illustrative results in the data section above. No materials and no internet. Compute both porosities and the retained water for each material, graph porosity and drain time side by side, and answer every analysis question, including the specific-yield estimate for sand. Option C — kitchen materials. Run the same method on three things almost every kitchen has: dry rice, dried beans and granulated sugar. They are a grain-size series, just like gravel, sand and silt, so before you start predict which will behave like which and why. Measure porosity and drain time exactly as in Option A, then compare your porosities with the ranges this lesson gives for real aquifer materials (25-40% for sorted sand and gravel, 40-60% for clay, under 1% for unfractured granite) and with the USGS values for aquifer materials printed in this lesson’s reading. Explain in your answer why sugar, which has the smallest grains, does not behave like clay.
Formative check
Work through these before moving on. They are not graded — they tell you whether the standard below has landed yet.
A 200 mL sample of sand takes 64 mL of water to fill its pores. What is its porosity?
Because clay has a very high porosity, it makes an excellent aquifer.
If the water table under 1 km² falls 1 m in an aquifer with a specific yield of 0.20, about m³ of water, or about acre-feet, has been removed.
Before the lab, write your prediction for which material has the highest porosity and which drains fastest, with a reason for each. After the lab, compare your prediction with your data and explain any surprise.
How confident are you that you can measure porosity and permeability and explain how they control an aquifer?
Practice
Work these on paper or in your notebook, then open Check your answer. Aim for all of Fluency and Application; try at least one Challenge.
Printable version: this unit’s practice workbook (PDF)
Fluency
Build speed and accuracy with the core skill.
- 100 mL of dry gravel takes 38 mL of water to fill its pores. What is its porosity?
Check your answer
Answer: 38% - A 250 mL sand sample holds 80 mL of water in its pores. What is its porosity?
Check your answer
Answer: 32% - 100 mL of water is poured onto dry sand in a holed cup and 72 mL drains out. How much water did the sand retain, as a volume and a percentage?
Check your answer
Answer: 28 mL, or 28% of the water poured100 − 72 = 28 mL; the retained water clings to grains and fills small pores.
Application
Use the skill in context. Show your reasoning.
- An aquifer under 50 km2 of farmland has a specific yield of 0.15. The water table falls 3 m in a drought. How much water was removed, in m3 and acre-feet?
Check your answer
Answer: 22,500,000 m3, about 18,241 acre-feet50,000,000 m2 × 3 m × 0.15. - Clay has a porosity of about 50% and gravel about 35%. Explain why gravel is the better aquifer.
Check your answer
Answer: Gravel’s pores are large and connected, so water flows through it readily (high permeability); clay’s tiny pores hold water tightly, so it barely flows. - In the lab, gravel drained in 8 s, sand in 45 s and soil in 190 s. Rank their permeabilities and suggest which would recharge fastest after a storm.
Check your answer
Answer: Gravel > sand > soil; gravel recharges fastest because water moves through it quickly.
Challenge
Stretch problems. Expect to think before you write.
- Gravel with a porosity of 0.38 has its pores completely filled with sand whose own porosity is 0.35. What is the porosity of the mixture? Use it to explain why poorly sorted sediment makes a poorer aquifer.
Check your answer
Answer: about 13.3%Only the pores inside the sand remain: 0.38 × 0.35. Mixed grain sizes fill each other’s spaces.
Review
Keep earlier skills sharp.
- What is the mass of 150.0 cm3 of water (density 1.0 g/cm3)?
Check your answer
Answer: 150.0 gMass = density × volume. - A wood sample has 70% of the carbon-14 of living wood. Using a half-life of 5,730 years, estimate its age.
Check your answer
Answer: ≈ 2,949 yearst = 5730 × log2(100/percent remaining).
What Sand Gives Back: USGS Values for Aquifer Materials, a Recorded Porosity Run and Missouri’s Groundwater
R. C. Heath, Basic Ground-Water Hydrology, USGS Water-Supply Paper 2220 (1983), table of selected values, p. 8; USGS county-level water-use data for 2015 (Missouri); Missouri DNR PUB3001; USGS SIR 2010-5227; SLS illustrative lab record; retrieved November 6, 2026 · Public domain (works of the United States government and Missouri state agencies), with SLS original illustrative data
Why this reading. Your lab measures porosity and drain time for three materials. Two things are missing from the lesson: the published values for real aquifer materials that Option C tells you to compare against, and a full recorded run of the procedure for anyone taking Option B, with enough trials to talk about error. Both are here. The recorded run is an SLS teaching data set, built to behave the way the lesson’s short Option B table does and labeled illustrative; it is not a measurement anyone published.
Table 1. Published values for porosity, specific yield and specific retention
Ralph Heath’s Basic Ground-Water Hydrology (USGS Water-Supply Paper 2220, 1983), still the standard introduction, gives “selected values” in percent by volume. Porosity n is the total pore space; specific yield Sy is the part that drains by gravity; specific retention Sr is the part that clings to the grains, so n = Sy + Sr.
| Material | Porosity (%) | Specific yield (%) | Specific retention (%) |
|---|---|---|---|
| Soil | 55 | 40 | 15 |
| Clay | 50 | 2 | 48 |
| Sand | 25 | 22 | 3 |
| Gravel | 20 | 19 | 1 |
| Limestone | 20 | 18 | 2 |
| Sandstone (semiconsolidated) | 11 | 6 | 5 |
| Granite | 0.1 | 0.09 | 0.01 |
| Basalt (young) | 11 | 8 | 3 |
Two lines in that table decide the lesson’s true-false check. Clay has the second-highest porosity, 50%, and the lowest specific yield of any sediment, 2%: almost all of its water stays put. Gravel has the lowest porosity of the loose sediments, 20%, and gives up 19 of those 20 points. The lesson’s own ranges, 25–40% for well-sorted sand and gravel and 40–60% for clay, are broader because packing and sorting vary from sample to sample; Heath’s are single typical values. Both agree on the point that matters: porosity says how much water a material holds, specific yield how much it will give, and the two are different properties.
Table 2. A recorded run of the lab procedure (SLS illustrative data)
Procedure as in the lesson: 100 mL of dry material settled by tapping in a 250 mL cup; water poured from a graduated cylinder until it just reached the surface (porosity); then 100 mL of dry material in a cup with six 3 mm holes, 100 mL of water poured on at once, timed until no drip for 5 seconds, and the water collected below measured (drain time and collected volume). Three trials with fresh dry material each time, n = 3 per material. Room temperature 21 °C. The first two trials of the three geologic materials are the figures printed in the lesson’s Option B table; the third trial and the three kitchen materials of Option C are added here. Constructed teaching numbers, not measurements.
| Material | Water to fill pores (mL) and porosity | Drain time (s) | Water collected below (mL) and retained | ||||||||||
|---|---|---|---|---|---|---|---|---|---|---|---|---|---|
| T1 | T2 | T3 | Mean | Porosity | T1 | T2 | T3 | Mean | T1 | T2 | T3 | Retained (mL) | |
| Aquarium gravel (3-5 mm) | 41 | 39 | 40 | 40.0 | 40.0% | 6 | 7 | 6 | 6 | 92 | 91 | 93 | 8 |
| Play sand (0.2-0.5 mm) | 33 | 31 | 32 | 32.0 | 32.0% | 38 | 44 | 41 | 41 | 74 | 71 | 73 | 27 |
| Clay-rich garden soil | 47 | 45 | 49 | 47.0 | 47.0% | 315 | 402 | 356 | 358 | 31 | 24 | 28 | 72 |
| Dry long-grain rice | 38 | 40 | 39 | 39.0 | 39.0% | 9 | 8 | 10 | 9 | 84 | 86 | 85 | 15 |
| Dried pinto beans | 43 | 41 | 42 | 42.0 | 42.0% | 5 | 5 | 4 | 5 | 95 | 96 | 95 | 5 |
| Granulated sugar | 40 | 39 | 41 | 40.0 | 40.0% | 52 | 58 | 55 | 55 | 62 | 60 | 61 | 39 |
Worked from the table
- Porosity = water added / 100 mL. Gravel (41 + 39 + 40)/3 = 40.0 mL, so 0.40 or 40%. Sand 32%. Soil 47%. Rice 39%, beans 42%, sugar 40%. Compare Heath: gravel 20%, sand 25%, soil 55%. Aquarium gravel is rounder and more uniform than river gravel, so it packs more loosely; both the lab and the USGS agree that the soil holds the most.
- Retained water = 100 − collected. Gravel 100 − 92 = 8 mL; sand 27 mL; soil 72 mL. The order is the reverse of the drain order, as it should be.
- Specific yield estimate for sand = collected / 100 mL = 73/100 = 0.73. That is far above Heath’s 22% because the lab pours water through the sample rather than draining a saturated one, so most of what is collected never occupied a pore at all. A fairer estimate uses only the pore water: water that entered the pores was 32 mL, and of the 100 mL poured on, 27 mL stayed behind, so the pore water that drained is at most 32 − 27 = 5 mL, giving Sy ≈ 5/32 ≈ 0.16, or 16%. That is the right order of magnitude for sand. Say which estimate you used and why.
- Trial-to-trial spread: soil drain times range from 315 to 402 s, a spread of 87 s or about 24% of the mean; gravel’s spread is 1 s. Deciding when dripping “stops” is a larger source of error for slow materials than for fast ones. Report a mean and a range, not one number.
- Sugar is not clay. Sugar has the smallest grains of the kitchen set and drains in 55 s, slower than rice or beans but nowhere near soil’s 356 s, and it dissolves as water passes, opening its own pores. Clay’s slowness comes from flat, electrically charged particles a thousand times smaller than a sugar grain, which hold water films in place. Grain size predicts the order; it does not predict the size of the gap.
Scale, checked
The lesson’s fill-in: an aquifer under 1 km2 with specific yield 0.20 whose water table falls 1 m loses 1,000,000 m2 × 1 m × 0.20 = 200,000 m3, and 200,000 / 1,233 = 162 acre-feet. Heath’s specific yield for sand, 22%, would give 220,000 m3; for clay, 2%, only 20,000 m3. The same 1 m drop in the water table means ten times more water removed from a sand aquifer than from a clay one, which is why wells are drilled into sand and gravel and why clay layers are called aquitards.
Missouri’s groundwater, by the numbers
The USGS compiles water withdrawals for every county every five years. For Missouri in 2015 (Dieter and others, 2018), fresh water withdrawn in million gallons per day (Mgal/d):
| Use | Groundwater (Mgal/d) | Surface water (Mgal/d) | Groundwater share |
|---|---|---|---|
| All uses | 1,737.48 | 6,689.66 | 20.6% |
| Thermoelectric power (mostly cooling water) | 13.75 | 5,842.63 | 0.2% |
| All uses except thermoelectric | 1,723.73 | 847.03 | 67.1% |
| Irrigation | 1,298.32 | 75.29 | 94.5% |
| Public supply (city water) | 281.59 | 515.50 | 35.3% |
| Self-supplied domestic (household wells) | 57.46 | 0 | 100% |
Those rows are the figures behind the lesson’s “about two-thirds (67%)” and “almost all irrigation water (95%).” Power plants withdraw huge volumes of river water for cooling and return most of it, which is why the lesson leaves them out.
Two Missouri aquifers show both halves of this lesson. The Bootheel’s alluvial aquifer is unconsolidated sand and gravel, the material of the lab: the Missouri Department of Natural Resources describes it as holding up to 21 trillion gallons and supporting irrigation wells that pump up to 3,000 gallons per minute. The Ozark aquifer is dolomite and sandstone, rock with modest porosity; USGS reports that wells open to its full thickness near Springfield typically yield 1,000 gallons per minute or more, because solution-enlarged fractures and bedding planes, the plumbing of the Ozarks’ springs, sinkholes, caves and losing streams, carry water quickly. Heath’s 20% porosity for limestone in Table 1 is a typical value for porous carbonate rock; in karst, permeability depends far more on the dissolved channels than on the pores.
Sources: Heath, R. C., Basic Ground-Water Hydrology, USGS Water-Supply Paper 2220 (pubs.usgs.gov); USGS Water Science School, Aquifers and groundwater (usgs.gov); Dieter, C.A., and others, 2018, Estimated use of water in the United States county-level data for 2015 (ver. 2.0), USGS data release (sciencebase.gov); Missouri DNR, Southeastern Lowlands Groundwater Province (PUB3001) (dnr.mo.gov); Richards, J.M., 2010, Groundwater-flow model … Ozark Plateaus aquifer system in the vicinity of Greene County, Missouri, USGS SIR 2010-5227 (pubs.usgs.gov)