How can random genetic events consistently produce predictable patterns in inheritance?
explain how alleles on homologous chromosomes separate during meiosis, use Punnett squares to predict the results of a cross, and ask questions about the ratios seen on an ear of corn.
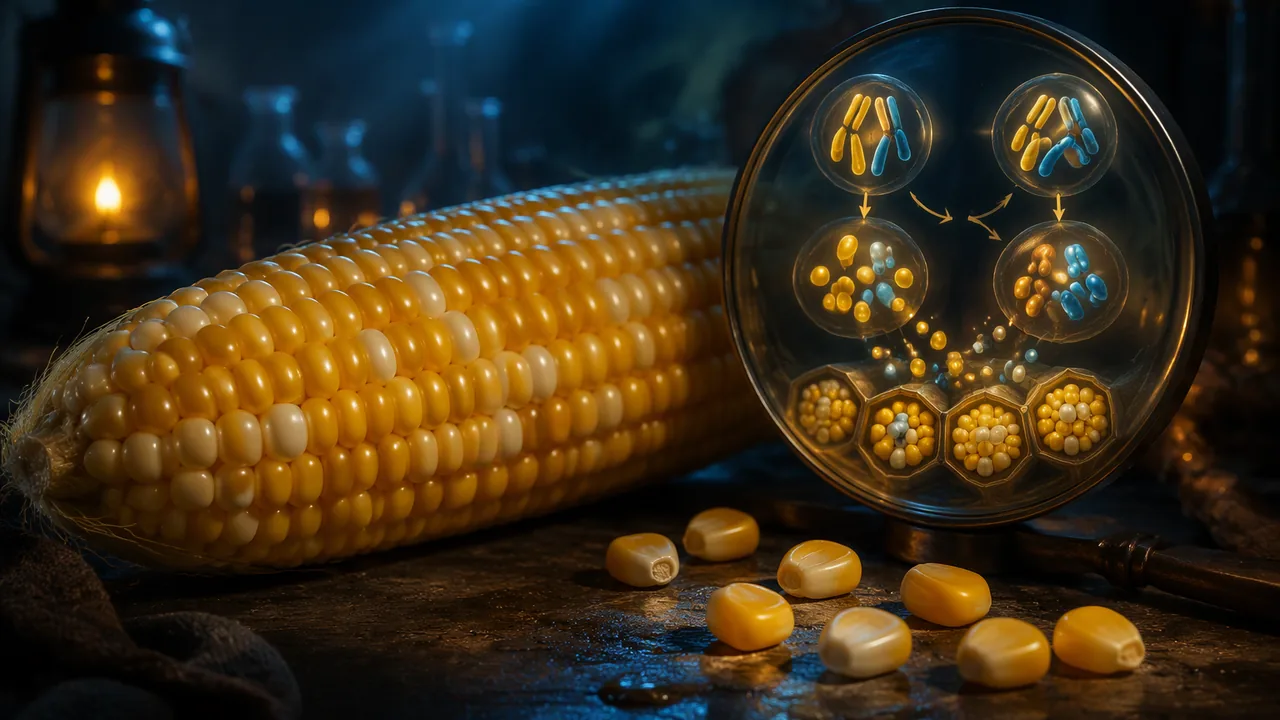
The phenomenon. Missouri farmers planted about 3.8 million acres of corn in 2025 and harvested about 673 million bushels of grain (USDA NASS). In summer, farmers’ markets and grocery stores across the state also sell bicolor sweet corn: ears with yellow and white kernels mixed together with no obvious pattern. Count a few rows and something strange appears: about three yellow kernels for every white one. (University of Missouri Extension describes bicolor ears as about 80 percent yellow and 20 percent white.) Genetic corn sold by biology suppliers shows the same kind of pattern in purple and yellow. Each kernel is a separate offspring, produced when a separate pollen grain fertilized a separate ovule. Why should hundreds of separate chance events add up to such a regular ratio, and is it really 3 : 1 or closer to 4 : 1?
The predictable ratios of inherited traits, like purple and yellow corn kernels, result from the separation of alleles during meiosis and their recombination during fertilization.
📖 Read for this lesson
The reading opens over the lesson; close it to come back to exactly where you were. The checks below draw on it.
Before learning Mendel’s answer, what initial ideas do you have about why some corn kernels are purple and some are yellow, and why there’s a ratio?
Two Pp corn plants are crossed and an ear of 400 kernels forms. How many yellow (pp) kernels do you expect?
Mendel’s answer
Gregor Mendel, a monk, published his groundbreaking work on inheritance in 1866, but its significance wasn’t fully appreciated by the scientific community until the early 1900s.
Gregor Mendel asked the same question of pea plants in the 1860s. When he crossed pure-breeding round-seeded plants with pure-breeding wrinkled-seeded plants, every offspring had round seeds. When he let those offspring self-pollinate, the next generation had 5,474 round and 1,850 wrinkled seeds, a ratio of 5,474 ÷ 1,850 ≈ 2.96 to 1. He explained it with inherited factors that come in pairs, one from each parent, and separate when reproductive cells form. We now call the factors genes, and the different versions of a gene alleles.
One of the different versions of a gene, such as the purple or yellow kernel allele.
A gamete from a Pp plant carries which alleles for kernel color?
Chromosomes carry the alleles
A body cell carries two copies of each chromosome, one from each parent; the pair are homologous chromosomes. The same gene sits at the same position on both, but the alleles may differ. Reproductive cells (pollen, eggs, sperm) form by meiosis, a two-step division that separates the homologous pairs, so each gamete gets one chromosome from each pair and therefore one allele of each gene. Human body cells have 46 chromosomes and gametes have 23; onion body cells have 16 and gametes 8.
A pair of chromosomes, one from each parent, that carry the same genes in the same positions.
A two-stage cell division that produces gametes with half the chromosome number, one from each homologous pair.
Traits are inherited completely randomly, so there’s no way to predict the chance of an offspring having a specific trait.
Punnett squares and the principles of meiosis show that while each fertilization is a chance event, the overall proportions of traits in many offspring can be predicted with surprising accuracy.
Mendel counted 5,474 round and 1,850 wrinkled seeds, a ratio of about to 1.
Punnett squares
Let P be the allele for purple kernels and p the allele for yellow. P is dominant: one copy is enough for purple, so PP and Pp kernels are purple and only pp kernels are yellow. Cross two Pp plants. Each parent’s gametes are half P and half p. The square has four equally likely boxes: PP, Pp, Pp, pp. The genotype ratio is 1 PP : 2 Pp : 1 pp, and the phenotype ratio is 3 purple : 1 yellow. On an ear of 500 kernels you would expect about 375 purple and 125 yellow, but not exactly, because each kernel is a chance event, like a coin toss. Bicolor sweet corn follows the same rule with Y (yellow, dominant) and y (white): the plants in the field are Yy, so their ears should be 3 yellow : 1 white, or 75 : 25, close to Extension’s description of 80 : 20.
The alleles an organism carries for a gene, such as Pp.
The observable trait that results from the genotype and the environment, such as purple kernels.
Count the yellow and white kernels in the three-row bicolor ear record in this lesson’s reading (or in three rows of a real bicolor sweet corn ear, if you have one). Record both colors, estimate the ratio, say whether it looks closer to 3 : 1 or 4 : 1, and write two questions about the ratio that data could answer.
Reading a pedigree
Geneticists also trace traits through families with a pedigree chart: squares for males, circles for females, shaded symbols for individuals who show the trait. In this course we use hypothetical pedigrees only; you will never be asked about your own family’s health. Here is one: two unaffected parents have an affected child. The trait must be recessive, and both parents must be carriers (Aa). Their unaffected children are AA or Aa; of those three equally likely boxes, two are Aa, so an unaffected child has a 2/3 chance of being a carrier.
A chart that traces a trait through generations of a family; in this course, always hypothetical.
Questions to ask
How close to 3 : 1 is close enough, and could a real ear tell 75 : 25 from 80 : 20? What would a 9 : 3 : 3 : 1 ear look like? And if meiosis simply splits pairs, where does new variation come from? The unit answers each one with evidence.
Practice
Work these on paper or in your notebook, then open Check your answer. Aim for all of Fluency and Application; try at least one Challenge.
Printable version: this unit’s practice workbook (PDF)
Fluency
Build speed and accuracy with the core skill.
- In pea plants, where purple flowers (A) are dominant to white (a), and in a trait where A (dominant) masks a (recessive), cross AA × Aa. Give the genotype ratio and the probability of the dominant phenotype.
Check your answer
Answer: AA: 2/4, Aa: 2/4; P(dominant phenotype) = 1Draw the 2 × 2 Punnett square. - In corn, where purple kernels (A) are dominant to yellow (a), and in a trait where A (dominant) masks a (recessive), cross Aa × aa. Give the genotype ratio and the probability of the dominant phenotype.
Check your answer
Answer: Aa: 2/4, aa: 2/4; P(dominant phenotype) = 1/2Draw the 2 × 2 Punnett square. - In a hypothetical mouse population, where dark fur (A) is dominant to light fur (a), and in a trait where A (dominant) masks a (recessive), cross AA × aa. Give the genotype ratio and the probability of the dominant phenotype.
Check your answer
Answer: Aa: 4/4; P(dominant phenotype) = 1Draw the 2 × 2 Punnett square. - A body cell of a corn plant has 20 chromosomes. How many chromosomes are in its pollen (gametes)?
Check your answer
Answer: 10Meiosis halves the chromosome number, one from each homologous pair.
Application
Use the skill in context. Show your reasoning.
- In a hypothetical pedigree, two unaffected parents have a child with a recessive trait. What is the probability that their next child has the trait? That the next two children both have it?
Check your answer
Answer: 1/4; 1/16Both parents are Aa; P(aa) = 1/4 per child, independent: 1/4 × 1/4 = 1/16. - In the same hypothetical family, an unaffected sibling wonders about being a carrier. What is the probability?
Check your answer
Answer: 2/3Unaffected outcomes are AA, Aa, Aa (equally likely); 2 of 3 are Aa. - Mendel’s F2 peas had 6,022 yellow and 2,001 green seeds. Find the ratio and the expected counts under 3 : 1.
Check your answer
Answer: About 3.01 : 1; expected 6,017.25 yellow and 2,005.75 green6,022 ÷ 2,001 = 3.01. Total 8,023: × 3/4 = 6,017.25; × 1/4 = 2,005.75.
Challenge
Stretch problems. Expect to think before you write.
- Two parents heterozygous for two unlinked traits are crossed (AaBb × AaBb). What fraction of offspring show both recessive phenotypes, and what is the phenotype ratio?
Check your answer
Answer: 1/16; 9 : 3 : 3 : 1Independent assortment: P(aa) × P(bb) = 1/4 × 1/4. - A purple-kernel plant of unknown genotype is crossed with a yellow (pp) plant. Describe the two possible outcomes and what each tells you.
Check your answer
Answer: All purple offspring: the plant is almost certainly PP. About half purple and half yellow: the plant is Pp.A test cross reveals a hidden recessive allele because pp contributes only p.
Review
Keep earlier skills sharp.
- Transcribe and translate the template TAC GGA CTT CTC ATT.
Check your answer
Answer: mRNA AUG CCU GAA GAG UAA; Met-Pro-Glu-Glu (then stop)CCU = Pro; GAA and GAG both = Glu; UAA = stop.
Missouri farmers planted about 3.8 million acres of corn in 2025 (USDA NASS), and every bag of hybrid seed they bought was produced by controlled crosses whose kernel ratios follow the same rules you use in a Punnett square.
How does understanding meiosis and Punnett squares change your perspective on how traits are passed down from one generation to the next?
How confident are you that you can explain how alleles separate in meiosis and predict a cross with a Punnett square?
The Shift
- Alleles are different versions of a gene.
- Meiosis separates homologous chromosomes and alleles.
- Punnett squares predict genetic ratios.
Alleles, Meiosis and Punnett Squares: Missouri Corn
SLS reading for RLP Biology A, drawing on the NHGRI Talking Glossary and MedlinePlus Genetics on inheritance patterns; Missouri corn figures from the USDA NASS 2025 State Agriculture Overview for Missouri and University of Missouri Extension guide G6390, Growing Sweet Corn in Missouri (both retrieved 2026-11-05) · SLS original
Each kernel is an offspring
An ear of corn is a family portrait. Each kernel formed when a separate pollen grain fertilized a separate ovule on the cob, so each kernel is a separate offspring with its own genes. On genetic corn from a biology supplier, or on a bicolor sweet corn ear from the store, the kernel color you see reflects that kernel’s own genotype. Hundreds of independent fertilizations on one ear let you see the results of a cross all at once, and that is why the ratios show up so clearly.
Missouri corn and the bicolor ear
Corn is one of Missouri’s biggest crops. The USDA National Agricultural Statistics Service reports that Missouri farmers planted 3,800,000 acres of corn in 2025 and harvested 3,640,000 acres for grain, at 185 bushels per acre: 3,640,000 × 185 = 673,400,000 bushels. Most of it is yellow field corn. In summer, farmers’ markets and grocery stores also sell bicolor sweet corn, with yellow and white kernels mixed on the same ear. University of Missouri Extension describes bicolor ears as about 80 percent yellow and 20 percent white kernels.
Genetics predicts something slightly different. Yellow (Y) is dominant over white (y), and bicolor plants are heterozygous, Yy. When they pollinate one another, each kernel is YY, Yy, Yy or yy with equal chances, so the ear should be 3 yellow : 1 white, or 75 : 25. Is 80 : 20 a different ratio, or a rounded description of 75 : 25? Only counts can tell, and the next lesson shows how to decide.
Here is an illustrative record of the first three rows of one bicolor ear, counted the way the lab describes:
| Row | Yellow | White | Row total |
|---|---|---|---|
| 1 | 34 | 12 | 46 |
| 2 | 35 | 11 | 46 |
| 3 | 33 | 13 | 46 |
| Total | 102 | 36 | 138 |
102 ÷ 36 ≈ 2.83 yellow per white kernel. A 3 : 1 model predicts 138 × 3/4 = 103.5 yellow and 34.5 white; an 80 : 20 description predicts 110.4 yellow and 27.6 white. These three rows sit much closer to 3 : 1, but three rows are a small sample. If you can get a bicolor ear in season, count three rows yourself and compare.
Genes, alleles and chromosome pairs
A gene is a segment of DNA at a particular place on a chromosome. Different versions of the same gene are alleles. Body cells carry two copies of each chromosome, one inherited from each parent; the two copies form a pair of homologous chromosomes, carrying the same genes at the same positions, though not always the same alleles. A corn body cell has 20 chromosomes (10 pairs); a human body cell has 46 (23 pairs); an onion has 16 (8 pairs).
Gametes (eggs, sperm, pollen) are made by meiosis, a two-step division that separates the homologous pairs, so each gamete gets one chromosome from every pair, and therefore one allele of every gene. The chromosome number is halved: 46 to 23 in humans, 20 to 10 in corn, 16 to 8 in onion. Fertilization restores the full number. So a gamete from a Pp plant carries either P or p, never both and never neither.
Dominant and recessive
Let P be the allele for purple kernels and p the allele for yellow. P is dominant: one copy is enough to make purple pigment. p is recessive: its effect shows only when no P is present. The genotype is the pair of alleles (PP, Pp or pp); the phenotype is the trait you see (purple or yellow). PP and Pp are both purple; pp is yellow. Two identical alleles make an organism homozygous; two different alleles make it heterozygous.
Punnett squares
Write one parent’s possible gametes across the top and the other’s down the side; each box is an equally likely offspring. For Pp × Pp:
| P | p | |
|---|---|---|
| P | PP | Pp |
| p | Pp | pp |
Genotypes: 1 PP : 2 Pp : 1 pp. Phenotypes: 3 purple : 1 yellow, so P(yellow) = 1/4 and P(purple) = 3/4. The same method gives every one-gene cross:
| Cross | Genotypes | P(dominant phenotype) |
|---|---|---|
| Aa × Aa | 1/4 AA, 2/4 Aa, 1/4 aa | 3/4 |
| AA × Aa | 2/4 AA, 2/4 Aa | 1 |
| Aa × aa | 2/4 Aa, 2/4 aa | 1/2 |
| AA × aa | 4/4 Aa | 1 |
Expected counts = total × probability. From Pp × Pp, an ear of 400 kernels should have about 400 × 1/4 = 100 yellow and 300 purple; 500 kernels, about 375 purple and 125 yellow; 600 kernels, about 150 yellow. “About” matters. Each kernel is a separate chance event, like a coin toss, so an ear of 400 will rarely have exactly 100 yellow. The next lesson shows how to decide how far off is too far.
Mendel’s numbers
Gregor Mendel crossed pure-breeding round-seeded peas with wrinkled-seeded peas; all offspring were round. When those offspring self-pollinated, the next generation had 5,474 round and 1,850 wrinkled seeds: 5,474 ÷ 1,850 ≈ 2.96 to 1, very close to 3 : 1. For seed color he counted 6,022 yellow and 2,001 green: 6,022 ÷ 2,001 ≈ 3.01 : 1. With 8,023 seeds in total, a 3 : 1 model predicts 8,023 × 3/4 = 6,017.25 yellow and 8,023 × 1/4 = 2,005.75 green. He explained the pattern with paired “factors” that separate when reproductive cells form, which is exactly what meiosis does to alleles on homologous chromosomes.
Two genes at once and the test cross
If two genes are on different chromosomes, their alleles are sorted into gametes independently. For AaBb × AaBb, the chance of aa is 1/4 and of bb is 1/4, so both recessive traits appear together in 1/4 × 1/4 = 1/16 of offspring, and the phenotypes come in a 9 : 3 : 3 : 1 ratio.
A purple plant could be PP or Pp. To find out, cross it with a yellow pp plant, which can only give p. If all offspring are purple, the plant is almost certainly PP. If about half are yellow (a 1 : 1 ratio), it must be Pp, because only a heterozygote can pass on a hidden p.
Reading a hypothetical pedigree
A pedigree uses squares for males, circles for females and shaded symbols for individuals who show a trait. (In this course, pedigrees are always hypothetical.) Suppose two unaffected parents have an affected child. The trait must be recessive, and both parents must be carriers, Aa. For each further child, P(aa) = 1/4; for two further children both affected, 1/4 × 1/4 = 1/16, because each child is an independent event. An unaffected sibling is AA, Aa or Aa, three equally likely boxes, so the chance they are a carrier is 2/3.
Review
Template TAC GGA CTT CTC ATT is transcribed to mRNA AUG CCU GAA GAG UAA, which translates to Met-Pro-Glu-Glu, then stop (CCU is proline; GAA and GAG are both glutamic acid; UAA is a stop codon).
Sources: NHGRI Talking Glossary: Allele (genome.gov); NHGRI Talking Glossary: Meiosis (genome.gov); NHGRI Talking Glossary: Mendelian Inheritance (genome.gov); MedlinePlus Genetics: What are the different ways a genetic condition can be inherited? (medlineplus.gov); MedlinePlus Genetics: How do cells divide? (medlineplus.gov); USDA NASS, 2025 State Agriculture Overview: Missouri (corn and soybeans planted, harvested, yield and production), retrieved 2026-11-05 (nass.usda.gov); University of Missouri Extension, G6390 Growing Sweet Corn in Missouri (bicolor kernels; isolation by 250 feet or 14 days), retrieved 2026-11-05 (extension.missouri.edu)