How do the unseen movements of tiny carbon atoms explain global patterns in Earth’s atmosphere?
build a physical model showing that atoms are conserved when sugar is made, rearranged and broken down, and explain the seasonal cycle in atmospheric carbon dioxide.
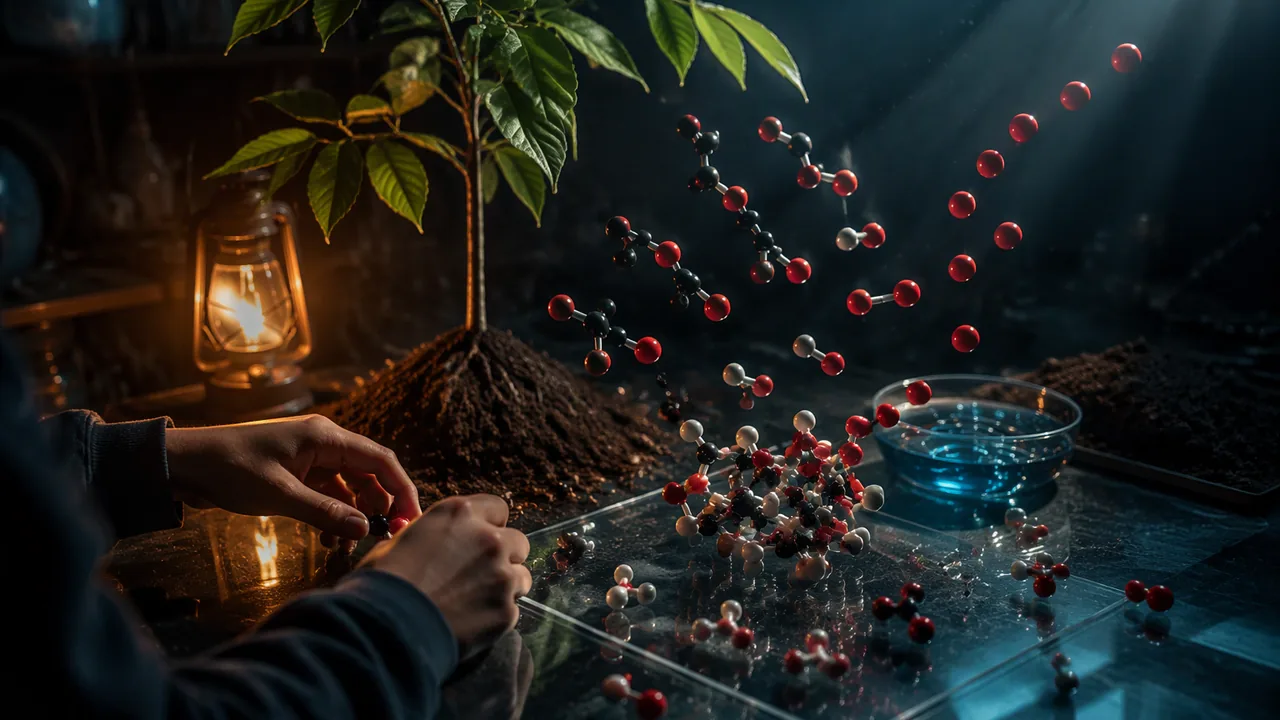
Two processes, one cycle. Photosynthesis takes carbon dioxide out of the air and stores its carbon in sugar. Cellular respiration, in plants, animals, fungi and bacteria, breaks sugar down and returns the carbon to the air. The two equations are mirror images, and together they move carbon between the atmosphere and the biosphere. Carbon also moves into the hydrosphere (carbon dioxide dissolves in the ocean, where algae photosynthesize) and the geosphere (shells, limestone, and buried plant matter that becomes peat, coal or oil). 9-12.LS2.B.3 asks you to model these exchanges.
Atoms are conserved as carbon cycles between different forms and reservoirs, driving the seasonal changes observed in atmospheric carbon dioxide.
📖 Read for this lesson
The reading opens over the lesson; close it to come back to exactly where you were. The checks below draw on it.
What challenges might exist in trying to trace the path of individual carbon atoms in the environment?
Why does CO2 at Mauna Loa fall each Northern Hemisphere summer?
Modeling atoms with beads
The same carbon atoms that make up your body have been cycled through countless other living things, the atmosphere, and the oceans over Earth’s history.
Use three colors: black for carbon, white for hydrogen, red for oxygen. Build six CO2 (6 black, 12 red) and six H2O (12 white, 6 red): 6 C, 12 H and 18 O in all. Now rearrange them, with no beads added or removed, into one glucose (6 C, 12 H, 6 O) and six O2 (12 O). Count: 6 + 12 = 18 oxygen atoms. Nothing was created or destroyed; the atoms were rearranged, and the light energy you supplied is represented by the work of pulling bonds apart. Run it backward for respiration.
When a plant grows, it creates new carbon atoms to build its structure.
Plants take existing carbon atoms from atmospheric carbon dioxide and rearrange them to form sugars and other molecules, demonstrating that atoms are not created or destroyed.
Each kilogram of carbon in wood came from about kg of CO2 (44.009 ÷ 12.011, three decimal places).
From sugar to other molecules (9-12.LS1.C.3)
Take the glucose apart again and rebuild some of its atoms into part of an amino acid. You will need a new color for nitrogen, which comes from the soil, not from photosynthesis. Build a fatty-acid chain from carbon and hydrogen and notice it has far fewer oxygens than sugar. The same C, H and O atoms from sugar end up in cellulose, proteins, fats and DNA.
In an ecosystem, both matter and energy cycle between organisms and the air.
How much carbon is in wood?
Dry wood is roughly half carbon by mass. Every kilogram of carbon that ends up in wood came from 44.009 ÷ 12.011 = 3.664 kg of carbon dioxide, because each CO2 contributes one carbon atom. So 100 kg of new dry wood holds about 50 kg of carbon, which was once about 50 × 3.664 ≈ 183 kg of carbon dioxide in the air.
Simulation & tools
Read the Mauna Loa carbon dioxide record
Your numbers come from this lesson’s two readings, and both parts of the record are hosted here. The annual means: ‘Sixty-Six Years of Carbon Dioxide’ carries NOAA’s Mauna Loa annual-mean table from 1959 to 2025 (public domain, NOAA Global Monitoring Laboratory, file co2_annmean_mlo.txt, created October 9, 2026, retrieved November 5, 2026), with its stated uncertainty of 0.12 ppm. The seasonal cycle: the year-by-year table of monthly highs and lows is under ‘Reading the Mauna Loa record’ in the carbon-cycle reading. No internet needed. Cite the figures as NOAA Global Monitoring Laboratory, Mauna Loa annual mean CO2, as hosted in this lesson. The card’s link goes to NOAA’s Climate.gov article, whose graph is drawn from the same record; it is there so you can see the curve, and nothing below requires it. Then: (1) read off the approximate CO2 concentration for 1960 and for the most recent year available. (2) Calculate the increase in ppm and as a percentage of the 1960 value. (3) Find the seasonal zigzag — the wiggle on the graph, or the monthly highs and lows in the table — and explain in two sentences which months are high and low and why, using photosynthesis and respiration.
Open NOAA ↗ · NOAA · Public domain (U.S. federal)
The planet breathes
NOAA has measured carbon dioxide at Mauna Loa Observatory, Hawaiʻi, since 1958. Two patterns appear in the record. First, a steady rise: from about 315 parts per million (ppm) in 1958 to about 425 ppm in 2024. Before industrialization, the concentration was about 280 ppm, so 2024 is roughly 52% higher. That rise comes mainly from burning fossil fuels, carbon that photosynthesis stored millions of years ago. Second, a yearly wiggle of about 6 ppm: carbon dioxide peaks around May and falls to a low around September or October. The Northern Hemisphere has most of Earth’s land plants. In spring and summer they photosynthesize faster than all organisms respire, and CO2 falls; in fall and winter, leaves drop, photosynthesis slows, respiration and decomposition continue, and CO2 rises. The wiggle is the biosphere’s photosynthesis and respiration, visible in the air.
A good carbon model shows each reservoir as a box, each process as a labeled arrow pointing the right way, and a note on whether each arrow carries matter, energy or both. Energy enters as light and leaves as heat; it does not cycle. Carbon cycles.
The movement of carbon among the atmosphere, biosphere, hydrosphere and geosphere through processes such as photosynthesis, respiration, dissolving and burial.
A place where carbon is stored, such as the air, living things, the ocean or rock.
Parts per million: here, molecules of CO2 per million molecules of air.
Key terms
An organism, such as a fungus or bacterium, that breaks down dead matter and releases its carbon through respiration.
Lab: Bead models of photosynthesis, respiration and biomolecules
Question. Are atoms conserved when sugar is built, rearranged into other molecules and broken down again?
Materials
- Pony beads or colored paper circles in four colors (carbon, hydrogen, oxygen, nitrogen)
- Pipe cleaners or toothpicks for bonds
- Zip bags labeled Reactants and Products
- Printed atom-count table
- Keep beads and toothpicks off the floor to prevent slips, and handle toothpicks point-down.
- Students with fine-motor difficulties may use paper circles and tape instead.
Procedure
- Build six CO2 and six H2O molecules and place them in the Reactants bag. Count and record each kind of atom.
- Take the molecules apart and rebuild them into one glucose and six O2, without adding or removing beads. Count and record again.
- Reverse the process to model aerobic respiration, recording the atom count at the start and end.
- Use the glucose atoms plus nitrogen beads to build the backbone of one amino acid (glycine: 2 C, 5 H, 1 N, 2 O). Record what is left over.
- Photograph each stage and label it with the process it represents and where the energy comes from or goes.
Data
| Stage | C | H | O | N | Energy in or out? |
|---|---|---|---|---|---|
| Photosynthesis reactants | |||||
| Photosynthesis products | |||||
| Respiration products | |||||
| Glycine + leftovers |
Analysis
- Use your atom counts to show that matter is conserved in both photosynthesis and respiration.
- Where did the nitrogen in your amino acid come from, and why could it not come from photosynthesis?
- Explain what your bead model shows well and one thing it cannot show (for example, energy or the stages inside the chloroplast).
If you cannot do this lab in person: Complete the same atom counts with drawn molecules on the printed worksheet, or with the PhET Balancing Chemical Equations simulation.
Practice
Work these on paper or in your notebook, then open Check your answer. Aim for all of Fluency and Application; try at least one Challenge.
Printable version: this unit’s practice workbook (PDF)
Fluency
Build speed and accuracy with the core skill.
- Find the molar mass of CaCO3.
Check your answer
Answer: 100.09 g/molAdd the atomic masses of every atom in the formula (Ca 40.078, C 12.011, O 15.999). - Find the molar mass of Al2O3.
Check your answer
Answer: 101.96 g/molAdd the atomic masses of every atom in the formula (Al 26.982, O 15.999). - What fraction of the mass of glucose (C6H12O6, 180.16 g/mol) is carbon? (C = 12.011)
Check your answer
Answer: About 40%6 × 12.011 = 72.07; 72.07 ÷ 180.16 = 0.400.
Application
Use the skill in context. Show your reasoning.
- A young oak adds 250 kg of dry wood in a decade. Assuming wood is half carbon, how much CO2 did it remove from the air?
Check your answer
Answer: About 458 kgCarbon = 125 kg; CO2 = 125 × 44.009/12.011 = 125 × 3.664 ≈ 458 kg. - Atmospheric CO2 at Mauna Loa was about 315 ppm in 1958 and about 425 ppm in 2024 (NOAA). Find the increase in ppm, the percentage increase, and the average rise per year.
Check your answer
Answer: 110 ppm; about 35%; about 1.7 ppm per year425 − 315 = 110; 110/315 = 0.349; 110/66 years = 1.67 ppm/yr. - To make amino acids from sugar, a plant needs one element that is not in CO2 or water. Which is it, and where does the plant get it?
Check your answer
Answer: Nitrogen, taken up from the soil as nitrate or ammoniumAmino acids contain an amino group (with N); sulfur is also needed for some.
Challenge
Stretch problems. Expect to think before you write.
- The Mauna Loa record rises and falls by about 6 ppm each year, peaking around May. Explain the timing, and predict whether a station in the Southern Hemisphere would show a larger or smaller yearly swing.
Check your answer
Answer: Northern Hemisphere plants photosynthesize fastest in spring and summer, drawing CO2 down until autumn; respiration and decay dominate in winter, so CO2 peaks before leaves come out. The Southern Hemisphere has much less land and fewer land plants, so its swing is smaller (and in the opposite season).Link the balance of photosynthesis and respiration to the seasons and to where land plants are.
Review
Keep earlier skills sharp.
- A cube-shaped cell of side 3 µm grows to side 6 µm. By what factor does its surface-area-to-volume ratio change?
Check your answer
Answer: It halves (from 2 to 1 per µm)Ratio = 6/s: 6/3 = 2 and 6/6 = 1.
The carbon cycle is at work across Missouri’s estimated 15.5 million acres of forest land (USDA Forest Service), where trees draw carbon dioxide from the air each growing season and release some back through respiration and decay.
How does the principle of atom conservation help us understand the seasonal fluctuations in atmospheric carbon dioxide levels?
How confident are you that you can model how carbon atoms move between air and living things and into other biological molecules?
The Shift
- Atoms are conserved, only rearranged.
- Carbon cycles through reservoirs via various processes.
- Photosynthesis and respiration cause seasonal CO2 changes.
Following Carbon Atoms, and Reading the Mauna Loa Record
SLS reading for Biology A, drawing on the NOAA Global Monitoring Laboratory Mauna Loa CO2 record and NOAA Climate.gov · SLS original
Four reservoirs, many arrows
Carbon is stored in four great reservoirs: the atmosphere (as CO2), the biosphere (living and dead organisms), the hydrosphere (dissolved in oceans, lakes and rivers) and the geosphere (limestone, shells, and buried remains that become peat, coal, oil and gas). Processes move carbon between them:
| Process | From | To | Carries |
|---|---|---|---|
| Photosynthesis (land plants, algae) | Atmosphere or water | Biosphere | Matter; light energy is stored in bonds |
| Cellular respiration (all organisms) | Biosphere | Atmosphere or water | Matter; energy released as ATP, then heat |
| Decomposition (fungi, bacteria) | Dead matter | Atmosphere | Matter (by the decomposers’ respiration) |
| Dissolving | Atmosphere | Ocean | Matter |
| Burial | Biosphere | Geosphere | Matter, over very long times |
| Combustion (wildfire, fossil fuels) | Biosphere or geosphere | Atmosphere | Matter; energy released as heat and light |
A good model draws each reservoir as a box and each process as a labeled arrow pointing the right way, and marks whether the arrow carries matter, energy or both. Energy enters as sunlight and leaves as heat; it does not go round. Carbon does.
Counting atoms with beads
Use black beads for carbon, white for hydrogen, red for oxygen and a fourth color for nitrogen. Six CO2 need 6 black and 12 red; six H2O need 12 white and 6 red. Total: 6 C, 12 H, 18 O. Rebuild them into one glucose (6 C, 12 H, 6 O) and six O2 (12 O): still 6 C, 12 H, 18 O. Run it backward for respiration and the count is unchanged. Nothing is created or destroyed. The beads cannot show energy, the steps inside the chloroplast, or the enzymes, which is a limitation to name in your analysis.
Now take the glucose apart to build glycine, the simplest amino acid (2 C, 5 H, 1 N, 2 O). You must add one nitrogen bead, because neither CO2 nor water contains nitrogen; a plant takes it from the soil as nitrate or ammonium. Glycine uses 2 C, 5 H and 2 O from the glucose, leaving 4 C, 7 H and 4 O for other molecules. The same atoms can become cellulose, fats (long carbon-hydrogen chains with few oxygens) or DNA (which also needs phosphorus from the soil).
From wood to carbon dioxide
Each CO2 molecule carries one carbon atom. So each kilogram of carbon stored in wood came from 44.009 ÷ 12.011 = 3.664 kg of CO2. Dry wood is roughly half carbon by mass. Two examples:
- 100 kg of new dry wood → about 50 kg of carbon → 50 × 3.664 ≈ 183 kg of CO2.
- A young oak adding 250 kg of dry wood in a decade → 125 kg of carbon → 125 × 3.664 ≈ 458 kg of CO2.
Mass fractions work the same way for any molecule. Glucose (180.16 g/mol) contains 6 × 12.011 = 72.07 g of carbon per mole, so it is 72.07 ÷ 180.16 = 40% carbon. For any molar mass, add the atomic masses of every atom in the formula: H 1.008, C 12.011, N 14.007, O 15.999, Na 22.990, Mg 24.305, Al 26.982, S 32.06, Cl 35.45, K 39.098, Ca 40.078 and Fe 55.845 g/mol. So NH3 = 14.007 + 3(1.008) = 17.03 g/mol and CaCO3 = 100.086 g/mol.
Reading the Mauna Loa record
NOAA has measured atmospheric carbon dioxide at Mauna Loa Observatory in Hawaiʻi since 1958. The annual mean was 316.91 ppm in 1960 (ppm = molecules of CO2 per million molecules of air), 424.61 ppm in 2024 and 427.35 ppm in 2025. Two patterns stand out.
A steady rise. Using the round values in your practice set, from about 315 ppm in 1958 to about 425 ppm in 2024: 425 − 315 = 110 ppm, a 110 ÷ 315 = 35% increase, averaging 110 ÷ 66 ≈ 1.7 ppm per year. From 1960 to 2025 the increase is 427.35 − 316.91 = 110.44 ppm, or 35% of the 1960 value. NOAA’s Climate.gov notes that before the Industrial Revolution CO2 was 280 ppm or less, and that the rise comes mostly from burning fossil fuels, which contain carbon stored by photosynthesis over millions of years. The 2024 Mauna Loa mean is 424.61 ÷ 280 ≈ 1.52 times, or about 52% above, that level. (Climate.gov uses the global average for 2024, 422.7 ppm, which is slightly lower than the Mauna Loa value, and describes today’s level as 50 percent higher than before the Industrial Revolution.)
A yearly wiggle. Each year the monthly mean peaks in May (or June) and falls to a low in September or October:
| Year | High (ppm, month) | Low (ppm, month) | Swing (ppm) |
|---|---|---|---|
| 2022 | 420.97 (May) | 415.74 (Oct) | 5.2 |
| 2023 | 424.00 (May) | 418.50 (Sep) | 5.5 |
| 2024 | 426.91 (Jun) | 422.03 (Sep) | 4.9 |
| 2025 | 430.51 (May) | 424.37 (Sep) | 6.1 |
The swing is about 5 to 6 ppm. Most of Earth’s land, and so most land plants, is in the Northern Hemisphere. In spring and summer those plants photosynthesize faster than all organisms respire, so they draw CO2 down until early autumn. In autumn and winter, leaves fall, photosynthesis slows, and respiration and decomposition continue, so CO2 climbs until the next spring. The wiggle is the biosphere breathing. Factories and cars do not stop in summer, so they cannot explain it. A station in the Southern Hemisphere, which has far less land, would show a smaller swing, timed to the opposite seasons.
Review: surface area and volume
A cube-shaped cell’s surface-area-to-volume ratio is 6/s. If its side grows from 3 µm to 6 µm, the ratio falls from 2 to 1 per µm: it halves.
Sources: NOAA Global Monitoring Laboratory: Trends in Atmospheric Carbon Dioxide (Mauna Loa) (gml.noaa.gov); NOAA GML: Mauna Loa annual and monthly mean CO2 data (gml.noaa.gov); NOAA Climate.gov: Climate Change – Atmospheric Carbon Dioxide (climate.gov); NASA Earth Observatory: The Carbon Cycle (earthobservatory.nasa.gov)
Sixty-Six Years of Carbon Dioxide: A Record That Almost Fits an Exponential
NOAA GML, annual mean carbon dioxide at Mauna Loa Observatory, file co2_annmean_mlo.txt (created October 9, 2026), retrieved November 5, 2026 · Public domain (works of the United States government)
Why this reading. The workshop asks you to solve abct = d for real, and to derive and interpret an inverse. Solving for t is only interesting when someone actually wants the answer to “when?” This is the longest continuous record of atmospheric carbon dioxide in the world, from NOAA’s Mauna Loa Observatory. Values are annual means in parts per million, dry air mole fraction.
Table 1. Annual mean CO2, Mauna Loa (ppm)
| Year | 1959 | 1960 | 1970 | 1980 | 1990 | 2000 | 2005 |
|---|---|---|---|---|---|---|---|
| ppm | 315.98 | 316.91 | 325.68 | 338.76 | 354.45 | 369.71 | 379.98 |
| Year | 2010 | 2015 | 2020 | 2021 | 2022 | 2023 | 2024 |
| ppm | 390.10 | 401.01 | 414.21 | 416.41 | 418.53 | 421.08 | 424.61 |
| Year | 2025 | The full file carries every year from 1959 to 2025, with a stated uncertainty of 0.12 ppm. | |||||
| ppm | 427.35 | ||||||
Three models, three answers to the same question
Let t be years after 1960 and C(t) the annual mean. Take 450 ppm as the level to solve for — a round number, and one that appears in policy discussion.
Model A, the endpoints 1960 and 2025. The growth factor is (427.35/316.91)1/65 = 1.004610, so CA(t) = 316.91(1.004610)t, about 0.461% a year. Solve 316.91(1.004610)t = 450: t = ln(450/316.91) / ln 1.004610 = 76.2, which lands in 2036. Check the model in the middle: CA(30) = 363.8 against an actual 354.45 in 1990. It is 9.4 ppm high, and always high in the middle, because the early years grew more slowly than the endpoints imply.
Model B, a least-squares fit to all 66 years. Regressing ln C on t gives a factor of 1.004641, about 0.464% a year, with 1960 value 310.15. Solving for 450 from the 2025 value gives 11.2 years, so again about 2036. The two exponential models agree almost exactly on the date and still both miss: this model predicts 419.05 for 2025 against an actual 427.35.
Model C, the last twenty years. (427.35/379.98)1/20 = 1.005892, about 0.589% a year. Solving ln(450/427.35)/ln 1.005892 = 8.8 years puts 450 ppm in 2034.
A linear model, for comparison. Least squares on the raw ppm gives 1.686 ppm a year, reaching 450 in 2045. That is nine to eleven years later than any of the exponential models, and the reason is visible in the data: the gaps between decades are 8.8, 13.1, 15.7, 15.3, 20.4 and 24.1 ppm. The increments themselves are growing, so a constant-slope line will always fall behind. Exponential is the better shape here, even though none of these models is a physical theory of anything.
The inverse, and what it is for
Model A’s inverse answers “what year?” directly. From C = 316.91(1.004610)t, solve for t: t(C) = ln(C/316.91) / ln 1.004610, defined for C > 0, and meaningful for C above 316.91, the range of CA on t ≥ 0. The composition check is the whole point of an inverse: t(CA(65)) should return 65, and it does. Doubling time, from ln 2 / ln 1.004610, is 150.7 years — a number worth saying out loud, because it shows how slow 0.46% a year sounds and how fast 111 ppm in 66 years looks.
Where the model is wrong, and why that matters
Annual means hide a sawtooth. Mauna Loa readings rise and fall within every year by about 6 ppm as Northern Hemisphere plants take up carbon in summer and release it in autumn — the seasonal signal you will model with a sinusoid in Unit 3. An annual-mean model cannot tell you the value in May. More importantly, no exponential is a mechanism. This curve bends because of emissions, oceans and land uptake, all of which are policy- and physics-dependent, and any of which can change the curve inside a decade. A model that tells you 2036 is telling you what the last sixty-six years would give if nothing changed. Report the date and that sentence, or you have not reported the model.
Two more to solve. When does Model C reach 500 ppm? When did Model A pass 400 ppm, and how does that compare with the year the record actually crossed it? Both are one logarithm each, and both are worth checking against Table 1 rather than trusting.
Sources: NOAA Global Monitoring Laboratory, Trends in atmospheric carbon dioxide (gml.noaa.gov); NOAA GML, annual mean CO2 at Mauna Loa (data file) (gml.noaa.gov)