How can understanding genes and the environment help us explain the diverse traits we see in crops?
construct and defend a report that uses probability and statistics to explain the variation of discrete and continuous traits in a crop, and the genetic and environmental sources of that variation.
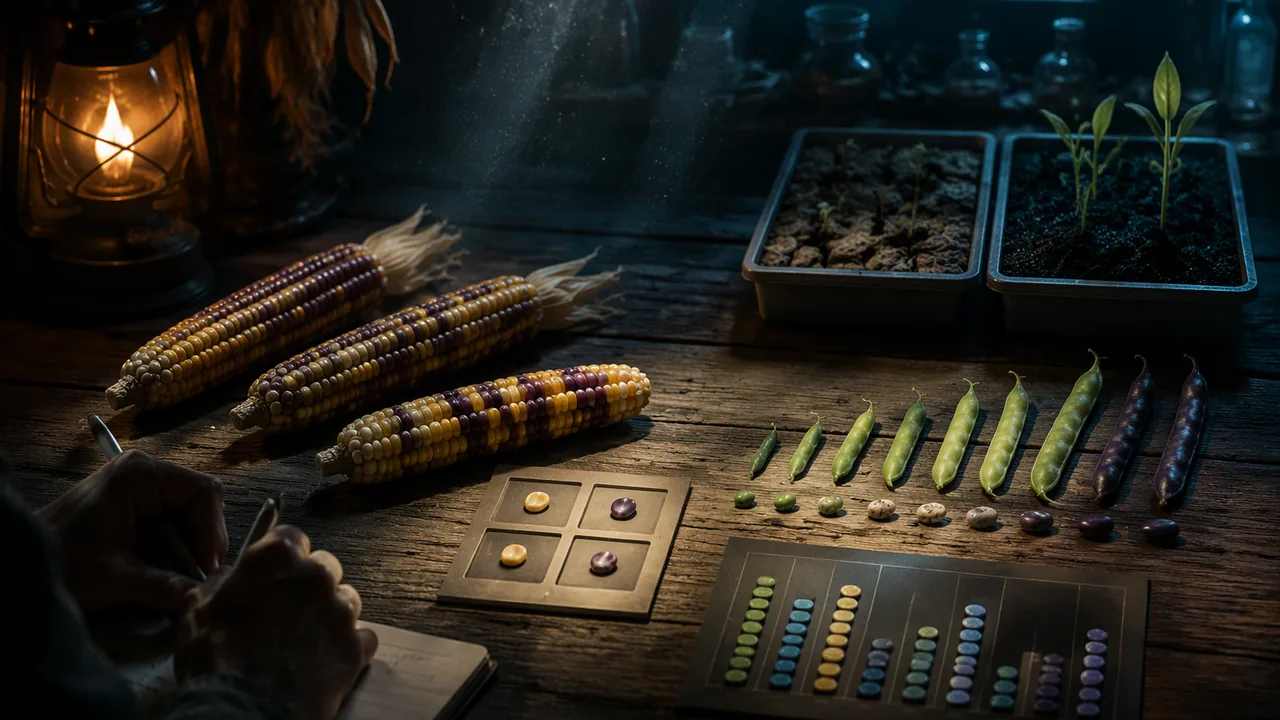
The scenario. A hypothetical seed company in the Missouri River bottoms grows sweet corn and dry beans for home and community gardens. Its growers have two questions: why do the kernels on our ears come in such regular ratios, and why do the seeds from one plant vary so much in size? You will answer both in a report written for the company’s growers, who know farming but not genetics.
Both genetic factors and environmental conditions contribute to the variation observed in crop traits, and statistical analysis helps us distinguish between these influences.
📖 Read for this lesson
The reading opens over the lesson; close it to come back to exactly where you were. The checks below draw on it.
When you look at a field of the same crop, what kinds of differences might you notice between individual plants?
Your ear gives χ2 = 0.384 with 1 degree of freedom. What should your report say?
What a strong report contains
The color of some plant flowers can change based on the pH of the soil, demonstrating a clear environmental influence on a visible trait.
- The discrete trait. Explain kernel color (or color and texture) with alleles, meiosis and a Punnett square. Test your own corn-ear counts with chi-square, showing the expected counts, the calculation, the degrees of freedom and your decision. Say what the result means in plain language, and what it does not prove.
- The continuous trait. Present your bean-length histogram with the mean and standard deviation. Explain the shape with polygenic inheritance, using the three-gene model or a larger one, and explain what the environment adds.
- Where the variation comes from. Explain at least two of the three sources of heritable variation from Lesson 4.3 (independent assortment, crossing over, replication errors or environmental mutagens) and why each would make offspring differ. Distinguish heritable variation from variation caused by growing conditions.
- A recommendation. Advise the company on one practical question, such as how to produce seed that grows only yellow kernels (University of Missouri Extension’s isolation advice is a good starting point), or how to test whether a size difference between two fields is genetic or environmental.
Differences between individuals that are caused by differences in DNA and can be passed to offspring.
All differences I see between plants are caused by their genes.
Differences between individual plants can be caused by variations in their DNA (heritable variation) or by their growing conditions (environmental variation), or a combination of both.
Seeds from the same plant can differ in length because of both the alleles each seed inherited and the conditions in which it developed.
A worked example of one link
Claim: the purple : yellow ratio on our ear is consistent with a cross between two heterozygous plants. Evidence: 381 purple and 119 yellow, with expected counts 375 and 125, give χ2 = 0.384 with 1 degree of freedom, below the critical value 3.84. Reasoning: each parent’s meiosis gives half P and half p gametes, so one quarter of kernels should be pp; the differences from 125 are the size we expect from chance.
Draft the recommendation section of your report: state the recommendation, the evidence it rests on, and one further test that would strengthen it.
Accuracy and care
Use your own data where you have it and label any illustrative data. Genetics can be personal, so keep examples to crops and hypothetical pedigrees.
Presentation
In four minutes, live or recorded, present your two key displays and answer one question about your statistics.
Key terms
The threshold probability (often 0.05) used to decide whether a difference is larger than chance would explain.
Differences between individuals caused by conditions such as water, light, soil or temperature, not by DNA.
Unit 4 checkpoint
Do this before you start the task. It covers the whole unit and tells you what to review first.
Which cross gives a 3 : 1 phenotype ratio?
From Pp × Pp, an ear of 600 kernels should have about yellow (pp) kernels.
Why does each gamete carry only one allele of each gene?
Observed 140 purple and 60 yellow; expected 150 and 50. χ2 = (two decimals).
With 1 degree of freedom, a χ2 of 2.67 means we reject the 3 : 1 model at the 0.05 level.
A 9 : 3 : 3 : 1 test has how many degrees of freedom?
Which mutation can be passed to offspring?
An organism with 5 pairs of chromosomes can make combinations by independent assortment.
Crossing over occurs between homologous chromosomes during meiosis I.
A histogram of seed lengths shows a single, symmetric peak with many intermediate values. The best explanation is:
In a normal distribution, about what percentage of values lie within one standard deviation of the mean?
Submit: Explaining Variation in a Crop (900-1,300 words with a chi-square test and a histogram) + four-minute presentation
Task: Write a report for the growers of a hypothetical Missouri seed company that explains (1) the ratio of kernel phenotypes on a corn ear, with Punnett squares and a chi-square test, and (2) the distribution of seed length in beans, with a histogram, mean and standard deviation. Explain the genetic sources of variation and separate them from environmental ones, and end with a recommendation. Use your own lab data where possible; hand-drawn displays are fully acceptable.
Submission workflow
- Stage 1 — Plan. Your two data displays in draft, your chi-square calculation, and an outline showing which evidence supports each section.
- Stage 2 — Checked draft. A reviewer (a parent, guardian or other adult reader, or you yourself after at least a day away) recomputes your expected counts, χ2 and summary statistics with the checklist in this lesson’s reading, and marks any claim without evidence; submit the notes and your revision plan.
- Stage 3 — Final report. 900-1,300 words with revised displays, calculations, citations and a limitations paragraph.
- Stage 4 — Presentation and defense. Four minutes, live or recorded, answering one question about your statistics.
How it is scored
| Criterion | What proficient looks like |
|---|---|
| Inheritance model (9-12.LS3.A.1) | Explains the discrete trait with alleles, meiosis and a correct Punnett square. |
| Probability and statistics (9-12.LS3.B.4, SEP.5) | Chi-square test and summary statistics are correct, with degrees of freedom, a decision and an accurate plain-language interpretation. |
| Sources of variation (9-12.LS3.B.3) | Explains at least two sources of heritable variation accurately and distinguishes them from environmental effects. |
| Patterns (CCC.1, CCC.2) | Explains the shape of the continuous distribution with a polygenic model and cause-and-effect reasoning. |
| Recommendation (SEP.6) | The recommendation follows from the evidence and names what further data would test it. |
| Use of evidence and communication (RST.9-10.1) | Claims tied to data and cited sources; clear for a non-specialist; presentation answers a question accurately. |
University of Missouri Extension advises growers to plant sweet corn about 250 feet from field corn and popcorn, or 14 days apart, because stray pollen changes the kernels it fertilizes: a practical decision built on exactly the genetics in your report.
How does using statistical evidence help you make a more convincing argument about the sources of variation in a crop?
How confident are you that you can use probability and statistics to explain variation in a crop and defend my conclusions?
The Shift
- Crop traits can be discrete (like color ratios) or continuous (like size ranges).
- Both genetics and environmental conditions cause variation in crops.
- Statistical tests help distinguish expected genetic patterns from chance differences.
Writing the Crop Variation Report
SLS reading for RLP Biology A, drawing on the NIST/SEMATECH e-Handbook of Statistical Methods and MedlinePlus Genetics; sweet corn isolation distances and dates from University of Missouri Extension guide G6390, Growing Sweet Corn in Missouri (retrieved 2026-11-05) · SLS original
Writing for growers
Your report answers two questions from a hypothetical Missouri seed company in the Missouri River bottoms that grows sweet corn and dry beans for home and community gardens: why kernel colors come in regular ratios, and why seeds from one plant vary so much in size. The readers know farming but not genetics, so every technical term needs a plain-language gloss the first time it appears, and every number needs units and a sentence saying what it means.
Part 1: the discrete trait
Kernel color is controlled by alleles of one gene: P (purple) is dominant, p (yellow) is recessive, so PP and Pp kernels are purple and only pp kernels are yellow. Meiosis separates the two alleles of a heterozygous plant, so half its gametes carry P and half carry p. A Punnett square for Pp × Pp gives 1 PP : 2 Pp : 1 pp, a phenotype ratio of 3 purple : 1 yellow. Each kernel is a separate offspring, so hundreds of independent chance events on one ear produce a ratio close to, but rarely exactly, 3 : 1.
Then test your own counts. The worked example below is the shape your section should take.
| Phenotype | Observed (O) | Expected (E) = 500 × proportion | (O − E)2/E |
|---|---|---|---|
| Purple | 381 | 500 × 3/4 = 375 | 36 ÷ 375 = 0.096 |
| Yellow | 119 | 500 × 1/4 = 125 | 36 ÷ 125 = 0.288 |
| Total | 500 | 500 | χ2 = 0.384 |
Two categories give 1 degree of freedom, and the critical value at the 0.05 level is 3.84. Since 0.384 < 3.84, do not reject the 3 : 1 model. In plain language for the growers: the counts are consistent with a cross between two heterozygous plants; the small differences from the predicted numbers are the size that chance alone would produce. Say clearly what the test does not do: it does not prove the model. Other models could also fit, and a bigger sample would test it more sharply.
Part 2: the continuous trait
Present the bean-length histogram with the mean and standard deviation marked. For the illustrative 30-bean set, mean 15.15 mm, SD 0.98 mm, range 12.9 to 17.2 mm, the bars rise to a single middle peak (1, 6, 12, 8, 3 in 1-mm bins from 12.5 mm) with tails on both sides. About 68% of values in a normal distribution lie within one SD of the mean, and in this sample 21 of 30 (70%) lie between 14.17 and 16.13 mm.
Explain the shape with polygenic inheritance: many genes each add a small amount, so an offspring’s value is the sum of many independent 50-50 events. In a three-gene model the classes come in the ratio 1 : 6 : 15 : 20 : 15 : 6 : 1 out of 64; extreme values need every allele to go the same way and so are rare, while intermediate values can be reached many ways and so are common. Add environmental effects, such as differences in water, light and position on the plant, and the classes blur into a smooth curve.
Part 3: where the variation comes from
Explain at least two heritable sources and separate them from environmental ones:
- Independent assortment. Each homologous pair lines up independently in meiosis I, giving 2n chromosome combinations; corn, with 10 pairs, gives 210 = 1,024 combinations per parent before crossing over.
- Crossing over. Paired homologs exchange segments, so a chromosome carrying AB and one carrying ab can produce Ab and aB chromosomes that neither parent had.
- Replication errors and mutagens. Rare copying errors and environmental damage create new alleles. Only changes in cells that form gametes are inherited.
- Environmental variation is not heritable. A plant that grew larger seeds because it had more water does not pass that on; its offspring inherit alleles, not conditions.
Part 4: the recommendation
Two recommendations that follow from the evidence:
- Seed that produces only yellow kernels. Yellow is recessive, so a plant with yellow kernels supplies only p. Grow a block of yellow-kernel plants and keep purple pollen away from it, because corn is wind-pollinated and each kernel’s color depends on the pollen that fertilized it. Practical steps: separate the block from purple corn by distance or by planting times that do not overlap, or bag the ears and hand-pollinate. University of Missouri Extension gives growers concrete numbers for the same problem in sweet corn: planting different types about 250 feet apart reduces cross-pollination, and a 14-day difference between planting dates prevents it. Check by counting a sample of ears: any purple kernels mean stray pollen or a hidden P allele, and a chi-square test against the predicted all-yellow result gives a decision rule.
- Testing whether a size difference between two fields is genetic or environmental. Grow seed from both fields side by side in the same field, in the same soil, with the same water, in randomly assigned plots, and measure seed length in both groups. If the difference disappears, it was environmental; if it persists, it points to genetic differences. Compare the difference in means with the standard deviations, as in the sun-and-shade data (a difference of 1.51 mm against SDs of 0.45 and 0.37 mm), and say what further data, such as more plots or more seasons, would strengthen the conclusion.
Checking your own statistics
- Use counts, not percentages, in the chi-square formula.
- Match the critical value to the degrees of freedom: 3.84 for two categories, 7.81 for four.
- Check that expected counts add up to the observed total.
- Label illustrative data as illustrative, and your own counts as your own.
- Before Stage 2, give this checklist to your reviewer (a parent, guardian or other adult reader), or use it yourself after at least a day away from the draft.
- Give units on every measurement and keep a sensible number of decimal places.
Keep the examples to crops and hypothetical pedigrees. Genetics can be personal, and nothing in this report should refer to any real person’s traits or family.
The four-minute defense
Plan to show two displays: the kernel table with its chi-square calculation, and the bean histogram with mean and SD marked. Expect a question about your statistics, such as “What would have made you reject the model?” A strong answer names the threshold and what it would have meant: a χ2 above 3.84 would mean differences this large arise by chance less than 5% of the time, so I would have looked for a different cross, a counting error, or unequal survival of kernel types.
Sources: NIST/SEMATECH e-Handbook of Statistical Methods: Chi-Square Goodness-of-Fit Test (itl.nist.gov); NIST/SEMATECH e-Handbook: Critical values of the chi-square distribution (itl.nist.gov); MedlinePlus Genetics: Is height determined by genetics? (medlineplus.gov); NHGRI Talking Glossary: Polygenic Trait (genome.gov); University of Missouri Extension, G6390 Growing Sweet Corn in Missouri (bicolor kernels; isolation by 250 feet or 14 days), retrieved 2026-11-05 (extension.missouri.edu)