2.05 Following Carbon: Atoms From Air to Tree and Back
build a physical model showing that atoms are conserved when sugar is made, rearranged and broken down, and explain the seasonal cycle in atmospheric carbon dioxide.
- I can use a model to show how matter and energy move between a plant and its environment during photosynthesis.
- I can use a model to explain how photosynthesis stores energy by changing the chemical bonds in the inputs (carbon dioxide and water) and outputs (sugar and oxygen).
- I can explain how the carbon, hydrogen, and oxygen atoms in sugar molecules are related to the same atoms found in amino acids and other large carbon-based molecules.
- I can explain that chemical reactions between sugar molecules (or their atoms) and other atoms can produce amino acids and other large carbon-based molecules.
- I can explain how carbon moves between organisms and the environment through carbon-containing compounds in my model.
- I can describe how carbon is stored in organisms as part of the carbon cycle in my model.
Phase 3: Make Sense
Warm-Up ~5 min
Do Now. Write the photosynthesis and respiration equations one above the other. What do you notice?
Carbon dioxide at a remote mountaintop observatory is measured every month. When in the year is it lowest?
Instruction ~10 min
Two processes, one cycle. Photosynthesis takes carbon dioxide out of the air and stores its carbon in sugar. Cellular respiration, in plants, animals, fungi and bacteria, breaks sugar down and returns the carbon to the air. The two equations are mirror images, and together they move carbon between the atmosphere and the biosphere. Carbon also moves into the hydrosphere (carbon dioxide dissolves in the ocean, where algae photosynthesize) and the geosphere (shells, limestone, and buried plant matter that becomes peat, coal or oil).
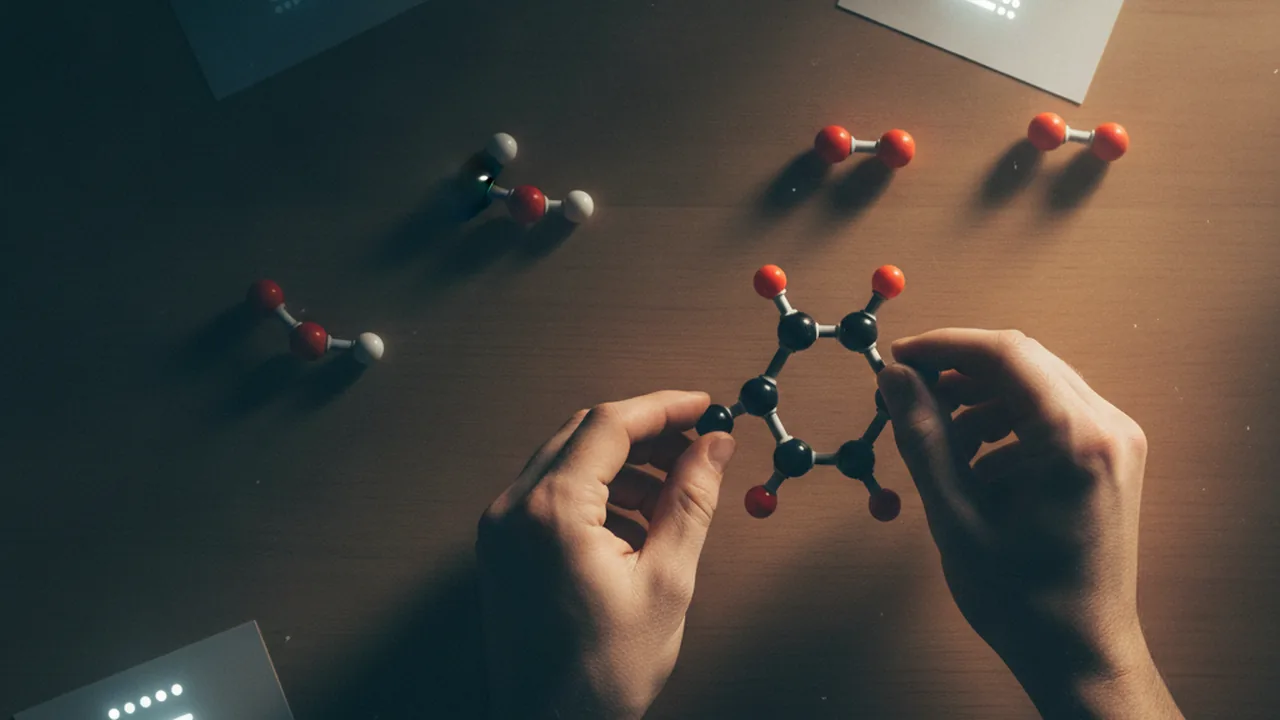
Modeling atoms with beads. Use three colors: black for carbon, white for hydrogen, red for oxygen. Build six CO2 (6 black, 12 red) and six H2O (12 white, 6 red): 6 C, 12 H and 18 O in all. Rearrange them, with no beads added or removed, into one glucose (6 C, 12 H, 6 O) and six O2 (12 O). Count: 6 + 12 = 18 oxygen atoms. Nothing was created or destroyed; the atoms were rearranged, and the light energy you supplied is represented by the work of pulling bonds apart. Run it backward for respiration.
From sugar to other molecules. Take the glucose apart and rebuild some of its atoms into an amino acid. You will need a new color for nitrogen, which comes from the soil, not from photosynthesis. Build a fatty-acid chain from carbon and hydrogen and notice it has far fewer oxygens than sugar. The same C, H and O atoms from sugar end up in cellulose, proteins, fats and DNA. Cells use energy released by respiration to drive the reactions that build these large molecules.
Worked example 1: how much carbon is in wood? Dry wood is roughly half carbon by mass. Every kilogram of carbon in wood came from 44.009 ÷ 12.011 = 3.664 kg of carbon dioxide, because each CO2 contributes one carbon atom. So 100 kg of new dry wood holds about 50 kg of carbon, which was once about 50 × 3.664 ≈ 183 kg of carbon dioxide in the air.
Worked example 2: the planet breathes. NOAA has measured carbon dioxide at Mauna Loa Observatory, Hawaiʻi, since 1958. Two patterns appear. First, a steady rise: from about 316 parts per million (ppm) in 1959 to about 425 ppm in 2024. Before industrialization the concentration was about 280 ppm, so 2024 is roughly 52% higher (425 ÷ 280 ≈ 1.52). That rise comes mainly from burning fossil fuels, carbon that photosynthesis stored millions of years ago. Second, a yearly wiggle of about 6 ppm: CO2 peaks around May and falls to a low around September or October. The Northern Hemisphere has most of Earth’s land plants. In spring and summer they photosynthesize faster than all organisms respire, and CO2 falls; in fall and winter, leaves drop, photosynthesis slows, respiration and decomposition continue, and CO2 rises.
A good carbon model shows each reservoir as a box, each process as a labeled arrow pointing the right way, and a note on whether each arrow carries matter, energy or both. Energy enters as light and leaves as heat; it does not cycle. Carbon cycles. Every model also simplifies: a box diagram does not show how fast each arrow runs, how carbon is split among many species, or where on Earth each exchange happens.
Lab procedure: bead models of photosynthesis, respiration and biomolecules.
- Build six CO2 and six H2O molecules and place them in the Reactants bag. Count and record each kind of atom.
- Take the molecules apart and rebuild them into one glucose and six O2, without adding or removing beads. Count and record again.
- Reverse the process to model aerobic respiration, recording the atom count at the start and end.
- Use glucose atoms plus nitrogen beads to build one amino acid (glycine: 2 C, 5 H, 1 N, 2 O). Record what is left over.
- Photograph each stage and label it with the process it represents and where the energy comes from or goes.
| Stage | C | H | O | N | Energy in or out? |
|---|---|---|---|---|---|
| Photosynthesis reactants | |||||
| Photosynthesis products | |||||
| Respiration products | |||||
| Glycine + leftovers |
Reading: OpenStax Biology 2e, chapters 3, Biological Macromolecules, and 8, Photosynthesis (CC BY 4.0); NOAA Global Monitoring Laboratory, Mauna Loa CO2 record (public domain).
Guided Exercises ~15 min
Use your bead model and atom-count table.
Independent Practice ~10 min
Draw the carbon model.
Draw a carbon-cycle model with four reservoirs (atmosphere, biosphere, hydrosphere, geosphere) and labeled arrows for photosynthesis, respiration, decomposition, dissolving and burial. Color matter arrows and energy arrows differently. Then write one thing your model shows well and one way the real carbon cycle differs from it.
Closure ~5 min
Atoms move from air to tree and back. Next we pull the whole unit into one explanation.
Exit ticket: 200 kg of new dry wood is about half carbon. How much CO2 did it come from? Show the steps.
How confident are you that you can model how carbon atoms move between air and living things and into other biological molecules.
Teacher notes
Materials: pony beads or colored paper circles in four colors, pipe cleaners or toothpicks, zip bags labeled Reactants and Products, printed atom-count tables, phones or tablets for photos.
Timing: this workshop spans two 50-minute periods: bead models on day 1, the Mauna Loa record and carbon-cycle diagram on day 2.
Data note: Mauna Loa annual means are about 316 ppm (1959) and about 425 ppm (2024); check NOAA’s current table before class if you want the latest year.
Listen for: “energy is recycled”; “carbon turns into energy.”
Support / stretch: give a pre-drawn reservoir diagram. Stretch: explain why the Southern Hemisphere’s seasonal CO2 wiggle is much smaller.