derive the constant-acceleration equations from a velocity-time graph, use them to compute reaction and braking distances, and argue from evidence which part of a stop dominates at a given speed.
Instruction
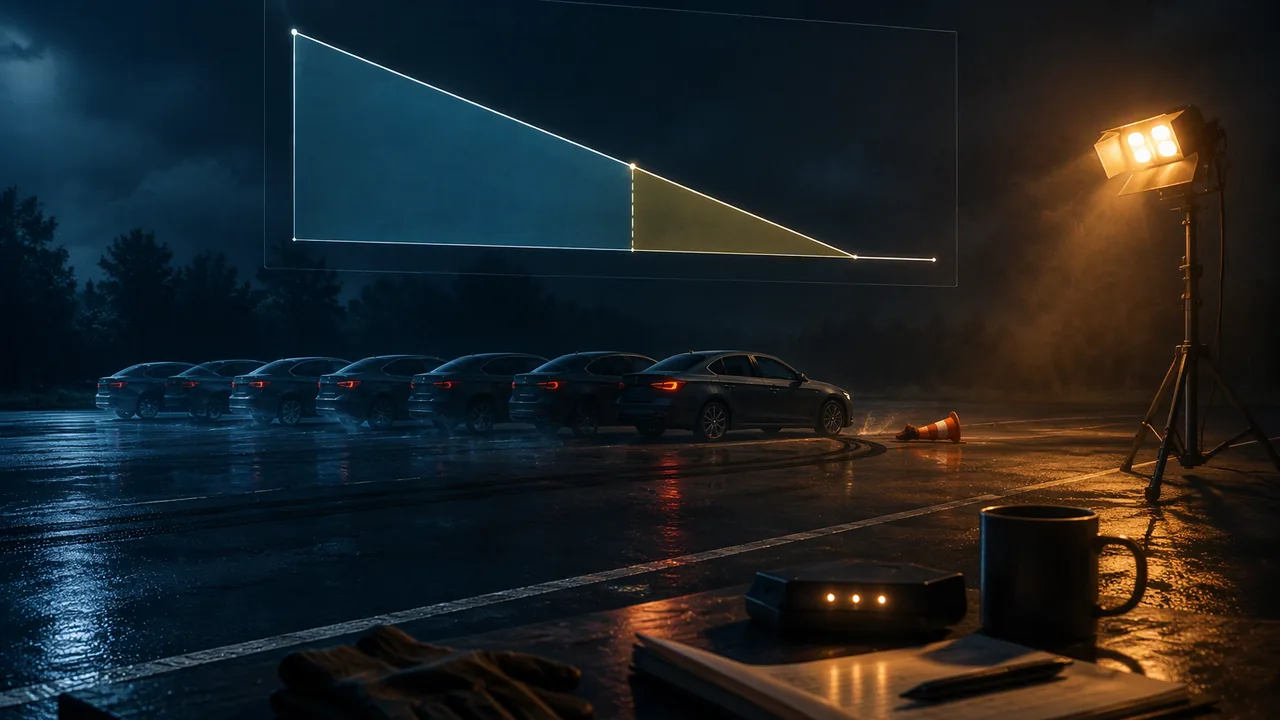
Three equations from one graph. For constant acceleration the velocity-time graph is a straight line from v0 at t = 0 to v at time t. Everything else follows from its slope and its area.
- Slope. a = (v − v0)/t, so v = v0 + at.
- Area. The region under the line is a rectangle of height v0 plus a triangle of height at: Δx = v0t + ½(t)(at), so Δx = v0t + ½at2. The same area is a trapezoid: Δx = ½(v0 + v)t.
- Eliminate time. Substitute t = (v − v0)/a into the trapezoid form: Δx = (v + v0)(v − v0)/(2a), so v2 = v02 + 2aΔx.
Check. v0 = 4 m/s, a = 2.5 m/s2, t = 6 s. Then v = 4 + 2.5(6) = 19 m/s. Rectangle plus triangle: 4(6) + ½(2.5)(36) = 69 m. Trapezoid: ½(4 + 19)(6) = 69 m. Third equation: 192 = 361 and 42 + 2(2.5)(69) = 16 + 345 = 361. All three agree.
Stopping a car. A stop has two stages. During the perception-reaction time tr the driver notices the hazard and moves a foot to the brake, and the car keeps its speed. Then the car decelerates to rest. Setting v = 0 in the third equation gives the braking distance v02/(2a), where a is the size of the deceleration:
dstop = v0tr + v02/(2a)
The table uses tr = 1.5 s, the alert-driver value the Missouri Driver Guide uses in its own stopping-distance chart (highway designers assume a longer, more cautious value), and a = 7.0 m/s2 for hard braking on dry pavement, a rounded illustrative value a little below the 7.4 m/s2 that the guide’s dry-pavement chart implies.
| Speed (mph) | v0 (m/s) | Reaction distance (m) | Braking distance (m) | Stopping distance (m) |
|---|---|---|---|---|
| 25 | 11.2 | 16.8 | 8.9 | 25.7 |
| 35 | 15.6 | 23.5 | 17.5 | 41.0 |
| 45 | 20.1 | 30.2 | 28.9 | 59.1 |
| 65 | 29.1 | 43.6 | 60.3 | 103.9 |
Reading the pattern. Reaction distance is proportional to speed. Braking distance is proportional to speed squared: from 25 to 45 mph the speed rises by a factor of 1.8, but braking distance rises by 1.82 = 3.24. The two parts are equal when v0tr = v02/(2a), that is at v0 = 2atr = 21 m/s (about 47 mph). Below that speed, reaction distance is the larger part. At 25 mph it is 16.8 m out of 25.7 m, about 65%. One extra second of looking at a phone adds 11.2 m at 25 mph, more than the whole braking distance. That is why the Missouri Driver Guide teaches a “three second rule” for following distance behind the car ahead.
Measure your own reaction time. A family member or friend holds a ruler vertically with the 0 mark between your open fingers. Without warning they release it, and you catch it. (Dropping it yourself does not work, because you know when it will fall. If no one is available, use the six-person ruler-drop record in this lesson’s reading.) The ruler falls from rest, so d = ½gt2 and t = √(2d/g). A catch at 20 cm means t = √(2 × 0.20/9.8) = 0.202 s. Do five trials and use the median. A ruler-drop time is shorter than a driving reaction time, because you are already watching and waiting. A driver must first notice an unexpected hazard, decide, and move a foot.
Building an argument. A strong scientific argument has a claim, evidence (numbers from the model or data) and reasoning (the physics that connects them), and it answers a counterclaim. For example: “At 25 mph, driver attention matters more than brakes.” The evidence is the table. The reasoning is that reaction distance grows with v but braking distance with v2. A good rebuttal considers the opposite case: on wet pavement a is smaller, which lengthens braking distance and lowers the crossover speed.
📖 Read for this lesson
The reading opens over the lesson; close it to come back to exactly where you were. The checks below draw on it.
Formative check
Work through these before moving on. They are not graded — they tell you whether the standard below has landed yet.
A car’s speed doubles from 20 mph to 40 mph on the same road. What happens to its braking distance (not counting reaction)?
Which statement correctly explains where Δx = v0t + ½at2 comes from?
With a reaction time of 1.5 s and braking at 7.0 m/s2, a car at 25 mph (11.2 m/s) covers more distance while the driver reacts than while it brakes.
Do the ruler drop five times with a helper (or take one person’s five trials from the ruler-drop record in this lesson’s reading) and compute the median reaction time. Then record a 90-second argument (or write 200 words) on the claim: “At school-zone speeds, reducing distraction saves more stopping distance than better brakes.” Use at least two calculated stopping distances as evidence, explain the v versus v2 reasoning, and answer one counterclaim (wet pavement, a younger or older driver, or a higher speed). Then, in two or three sentences, support, qualify or challenge this sample argument: “At 25 mph my brakes stop me in under 10 m, so a quick glance at my phone is not a real danger.”
How confident are you that you can derive the constant-acceleration equations from a graph and use stopping-distance calculations as evidence in an argument?
Practice
Work these on paper or in your notebook, then open Check your answer. Aim for all of Fluency and Application; try at least one Challenge.
Printable version: this unit’s practice workbook (PDF)
Fluency
Build speed and accuracy with the core skill.
- A car moving at 4 m/s speeds up at 2.5 m/s2 for 8 s. What is its final speed?
Check your answer
Answer: 24.0 m/sv = v0 + at. - A car moving at 13 m/s speeds up at 2 m/s2 for 7 s. What is its final speed?
Check your answer
Answer: 27.0 m/sv = v0 + at. - A car moving at 3 m/s speeds up at 2.5 m/s2 for 8 s. What is its final speed?
Check your answer
Answer: 23.0 m/sv = v0 + at. - An object is dropped from rest 45 m above the ground. Ignoring air resistance (g = 9.8 m/s2), how long does it fall and how fast is it moving at impact?
Check your answer
Answer: 3.03 s; 29.7 m/sh = ½gt2; v = gt. - An object is dropped from rest 20 m above the ground. Ignoring air resistance (g = 9.8 m/s2), how long does it fall and how fast is it moving at impact?
Check your answer
Answer: 2.02 s; 19.8 m/sh = ½gt2; v = gt. - A car at 30 mph (13.4 m/s) must stop. Reaction time 1.5 s, braking 7.0 m/s2. Find the reaction, braking and total stopping distances.
Check your answer
Answer: 20.1 m, 12.8 m, 33.0 mv = 30 × 0.44704 = 13.41 m/s. Reaction 13.41 × 1.5 = 20.1 m. Braking v2/(2a) = 12.8 m. Total 33.0 m. - A ruler dropped between your fingers is caught after falling 18 cm. What is your reaction time?
Check your answer
Answer: 0.192 st = √(2d/g) = √(2 × 0.18/9.8) = 0.192 s.
Application
Use the skill in context. Show your reasoning.
- Repeat the 30 mph stop on wet pavement where braking is only 4.5 m/s2. By how much does the stopping distance grow?
Check your answer
Answer: 40.1 m, 7.1 m longerBraking 20.0 m; total 20.1 + 20.0 = 40.1 m, which is 7.1 m more than dry. - A driver at 65 mph looks at a phone for 2.0 s. How far does the car travel blind?
Check your answer
Answer: 58 m65 × 0.44704 = 29.1 m/s; × 2.0 s = 58 m, longer than a football field’s 91 m. - With tr = 1.5 s and a = 7.0 m/s2, at what speed are reaction distance and braking distance equal? Use it to support or rebut: “At 25 mph, better brakes matter more than attention.”
Check your answer
Answer: v = 2atr = 21 m/s (about 47 mph); rebut the claimv tr = v2/(2a) gives v = 2atr = 21 m/s. Below that, reaction distance is the larger part, so at 25 mph attention matters more.
Challenge
Stretch problems. Expect to think before you write.
- A driver can see a crosswalk 30 m ahead. With a 1.0 s reaction time and 6.0 m/s2 braking, what is the highest speed at which the car can stop in time?
Check your answer
Answer: 13.9 m/s (about 31 mph)v + v2/12 = 30, or v2/12 + v − 30 = 0. Quadratic formula: v = 13.90 m/s.
Review
Keep earlier skills sharp.
- Solve: x2 + 6x − 7 = 0
Check your answer
Answer: x = −7 or x = 1Factor, then use the zero-product property. - Solve: x2 + 3x − 18 = 0
Check your answer
Answer: x = −6 or x = 3Factor, then use the zero-product property.
Stopping Distance in Missouri: The Driver Guide’s Chart, MoDOT’s Sight-Distance Table, and a Reaction-Time Record
Missouri Department of Revenue, Missouri Driver Guide (revised August 2026), chart “Average Stopping Distance of Cars on Dry Level Pavement” and “Three Second Rule”; MoDOT Engineering Policy Guide 941.7 Sight Distance for Entrances (941.7.1.2, 941.7.3) and its linked Stopping Sight Distance table (AASHTO Exhibit 3-1, file 941_SSD.pdf); all retrieved November 5, 2026; ruler-drop record is SLS illustrative data · SLS original (tables and explanation); cites public government records, statutes and published design values, with brief quotations only. Original: Brief excerpts and data values from Missouri state government publications and the AASHTO table MoDOT hosts, reproduced for education with attribution; SLS additions CC BY 4.0
Why this reading. The lesson asks you to argue, with calculated stopping distances as evidence, whether reaction or braking matters more at school-zone speeds, and to answer a counterclaim. Its own table uses 1.5 s and 7.0 m/s2. Two Missouri publications use the same physics with their own numbers: the Missouri Driver Guide, which every new Missouri driver studies, and the stopping-sight-distance table MoDOT’s engineers use on state highways. Here are both, with the reasoning you can extract from them, and a ruler-drop record so the reaction-time part of your argument has data even if no one is available to drop the ruler for you.
1. What the Missouri Driver Guide teaches
The Missouri Driver Guide (Missouri Department of Revenue, revised August 2026) defines stopping distance as reaction distance plus braking distance. Its chart, “Average Stopping Distance of Cars on Dry Level Pavement,” uses a reaction time of 1.5 seconds (the guide says a driver must be alert to react that fast) and braking distances for a car with good brakes and tires on a good road. The chart’s labels give reaction / braking distance in feet; the last three columns are SLS calculations (1 ft = 0.3048 m; implied deceleration a = v2/(2 × braking distance)).
| Speed (mph) | Reaction distance (ft), as printed | Braking distance (ft), as printed | Total (ft) | Total (m) | Implied a (ft/s2) | (m/s2) |
|---|---|---|---|---|---|---|
| 20 | 44 | 18 | 62 | 18.9 | 23.9 | 7.3 |
| 30 | 66 | 40 | 106 | 32.3 | 24.2 | 7.4 |
| 45 | 100 | 90 | 190 | 57.9 | 24.2 | 7.4 |
| 55 | 121 | 134 | 255 | 77.7 | 24.3 | 7.4 |
| 60 | 132 | 160 | 292 | 89.0 | 24.2 | 7.4 |
| 65 | 143 | 188 | 331 | 100.9 | 24.2 | 7.4 |
| 80 | 176 | 284 | 460 | 140.2 | 24.2 | 7.4 |
Check the reaction column yourself: 20 mph is 29.3 ft/s, and 29.3 × 1.5 = 44 ft. Every braking row implies almost the same deceleration, about 24 ft/s2 or 7.4 m/s2. So the state’s own chart is the lesson’s model with tr = 1.5 s and a deceleration a little harder than the lesson’s rounded 7.0 m/s2. The same guide teaches a “three second rule” for following distance: pick a sign or pole, and if you reach it before you finish counting three seconds after the car ahead passes it, you are too close.
2. What MoDOT designs to
When MoDOT decides whether a new driveway or street may join a state highway, it measures the stopping sight distance on site, sighting from a driver’s eye 3.5 ft above the road to a 2 ft object (about the height of taillights), and compares it with a table (EPG 941.7.1.2). The table MoDOT’s Engineering Policy Guide links is AASHTO’s Exhibit 3-1, reproduced here (U.S. customary half; the meter column is an SLS conversion).
| Design speed (mph) | Brake reaction distance (ft) | Braking distance on level (ft) | Calculated SSD (ft) | Design SSD (ft) | Design SSD (m) |
|---|---|---|---|---|---|
| 15 | 55.1 | 21.6 | 76.7 | 80 | 24 |
| 20 | 73.5 | 38.4 | 111.9 | 115 | 35 |
| 25 | 91.9 | 60.0 | 151.9 | 155 | 47 |
| 30 | 110.3 | 86.4 | 196.7 | 200 | 61 |
| 35 | 128.6 | 117.6 | 246.2 | 250 | 76 |
| 40 | 147.0 | 153.6 | 300.6 | 305 | 93 |
| 45 | 165.4 | 194.4 | 359.8 | 360 | 110 |
| 50 | 183.8 | 240.0 | 423.8 | 425 | 130 |
| 55 | 202.1 | 290.3 | 492.4 | 495 | 151 |
| 60 | 220.5 | 345.5 | 566.0 | 570 | 174 |
| 65 | 238.9 | 405.5 | 644.4 | 645 | 197 |
| 70 | 257.3 | 470.3 | 727.6 | 730 | 223 |
| 75 | 275.6 | 539.9 | 815.5 | 820 | 250 |
| 80 | 294.0 | 614.3 | 908.3 | 910 | 277 |
The note under the table states the assumptions outright: a brake reaction time of 2.5 s and a deceleration of 11.2 ft/s2 (3.4 m/s2). The design column is the calculated value rounded up, never down. Grades matter too. MoDOT’s downgrade table (EPG 941.7.3), worked out with the same 2.5 s and 11.2 ft/s2, raises the 35 mph value from 250 ft on the level to 258 ft on a 3% downgrade, 271 ft on 6% and 288 ft on 9%; you will see why in Unit 2, when gravity’s component along the slope works against the brakes.
Compare these assumptions with the Missouri Driver Guide‘s 1.5 s and 7.4 m/s2. Designers assume a slower driver and a gentler stop, because a road must be safe for the tired driver in the rain, not the ready one on a dry road.
3. What the two assumption sets do to the argument
| Speed | Lesson: tr 1.5 s, a 7.0 m/s2: reaction / braking / total (m) | MoDOT design: tr 2.5 s, a 3.41 m/s2: reaction / braking / total (m) | Design SSD (m) |
|---|---|---|---|
| 25 mph | 16.8 / 8.9 / 25.7 | 27.9 / 18.3 / 46.2 | 47 |
| 35 mph | 23.5 / 17.5 / 41.0 | 39.1 / 35.9 / 75.0 | 76 |
| 45 mph | 30.2 / 28.9 / 59.1 | 50.3 / 59.3 / 109.6 | 110 |
| 65 mph | 43.6 / 60.3 / 103.9 | 72.6 / 123.7 / 196.3 | 197 |
Under the lesson’s values the two parts are equal at 2atr = 21 m/s (47 mph); under the design values they are equal at 2 × 3.41 × 2.5 = 17.1 m/s (38 mph). Either way, at 25 mph the reaction distance is the larger part: 65% with the lesson’s values, 60% with the design values. The claim survives the change of assumptions, and saying so is what a rebuttal looks like.
A ruler-drop record (illustrative)
Six people (illustrative, not real measurements) each caught a falling ruler five times; the catch distance in centimeters is the reading at the fingers. t = √(2d/g) with g = 9.8 m/s2. Use the median of five, because one anticipated catch or one fumble should not move the result.
| Trial 1 (cm) | Trial 2 | Trial 3 | Trial 4 | Trial 5 | Median (cm) | t = √(2d/g) (s) | |
|---|---|---|---|---|---|---|---|
| Person 1 | 18 | 21 | 19 | 24 | 20 | 20 | 0.202 |
| Person 2 | 22 | 25 | 23 | 21 | 27 | 23 | 0.217 |
| Person 3 | 15 | 17 | 16 | 19 | 16 | 16 | 0.181 |
| Person 4 | 28 | 24 | 26 | 30 | 25 | 26 | 0.230 |
| Person 5 | 20 | 19 | 23 | 21 | 22 | 21 | 0.207 |
| Person 6 | 17 | 20 | 18 | 18 | 22 | 18 | 0.192 |
Every ruler-drop time here is between 0.18 and 0.23 s. A driving perception-reaction time is several times longer, because the driver must first notice an unexpected hazard, decide what it is, and move a foot from one pedal to another; the ruler catcher is already watching the ruler. That gap is the reason the design table uses 2.5 s, and even the Missouri Driver Guide‘s alert-driver value, 1.5 s, is about seven times a ruler-drop time. A stopping-distance argument that uses a ruler-drop time as the driver’s reaction time is using the wrong quantity, and a good rebuttal will say so.
Your turn
- Recompute the 45 mph row of the MoDOT table by hand (45 mph = 66 ft/s) with 2.5 s and 11.2 ft/s2, and show that it gives about 360 ft.
- Redo the lesson’s 25 mph stop with the design assumptions. By how many meters does each part grow (reaction distance by 11.2 m, braking distance by 9.4 m), and which part grows more? Explain with v versus v2 and the change in each assumption.
- On a 6% downgrade at 35 mph, MoDOT’s table asks for 271 ft. Subtract the 2.5 s reaction distance (128.6 ft) and find the effective deceleration that the remaining 142.4 ft implies. Compare it with 11.2 − 32.2 × 0.06 ft/s2, and say what the subtraction represents.
- Compute the median reaction time for Person 4 and Person 3 and the difference in reaction distance that makes at 25 mph. Then compare that difference with one second of looking at a phone.
Sources: Missouri Department of Revenue, Missouri Driver Guide (revised August 2026) (dor.mo.gov); MoDOT Engineering Policy Guide, Category 941 Permits and Access Requests (941.7 Sight Distance for Entrances) (epg.modot.org); MoDOT EPG, Stopping Sight Distance table (AASHTO Exhibit 3-1), 941_SSD.pdf (epg.modot.org)