specify the criteria and constraints for a yellow-light duration or school-zone speed limit, use a stopping-distance model to set a design value, and defend it with a sensitivity analysis.
Instruction
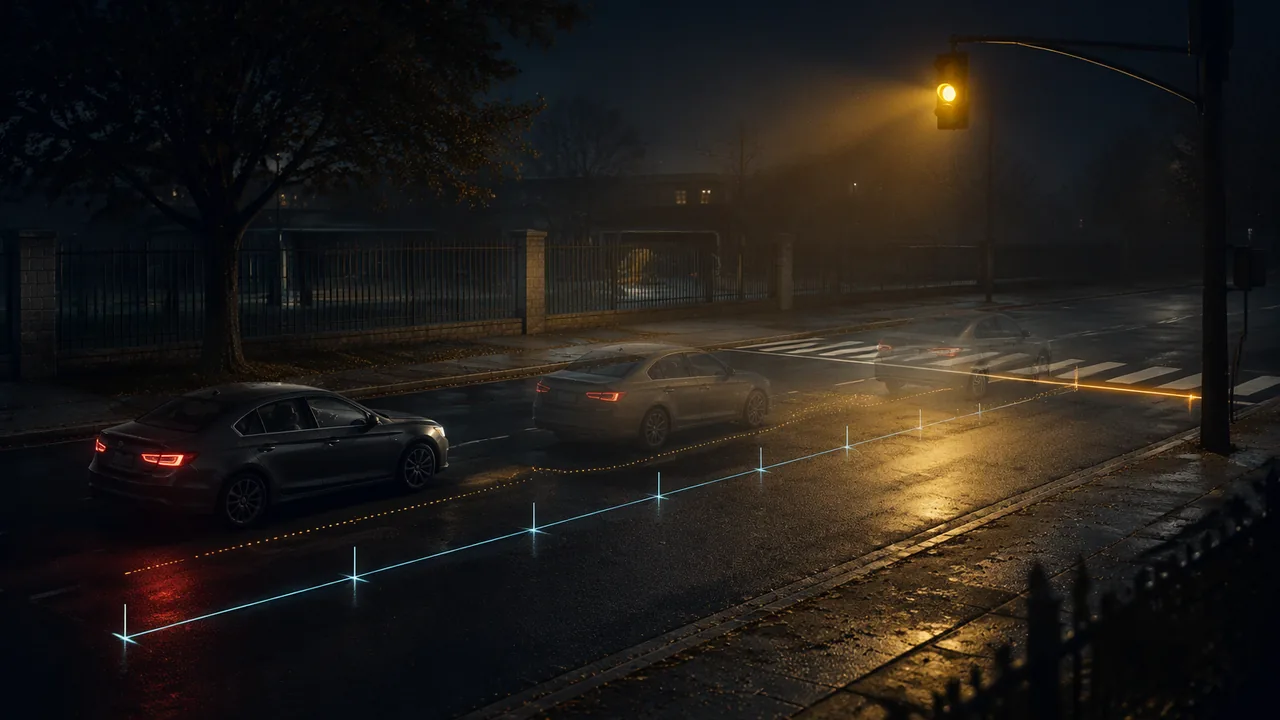
The engineering problem. When a signal turns yellow, a driver approaching at speed must either stop comfortably before the line or continue through before the light turns red. Engineers choose the yellow change interval so that every driver has one safe choice. Your task is to specify a design value, either a yellow duration or a school-zone speed limit, with explicit criteria (what counts as success) and constraints (limits you must work within). That is the first step of engineering design (9-12.ETS1.A.1).
A kinematic model of the yellow light. A driver who is just far enough back to stop comfortably needs time to react and then time to brake. The design time is the reaction time plus the time to cover the braking distance at the average speed v/2:
y = tr + v/(2a)
The widely used Institute of Transportation Engineers form of this model takes tr = 1.0 s and a comfortable deceleration of 10 ft/s2 (about 3.0 m/s2) on level ground. With those values:
| Approach speed (mph) | v (m/s) | Model yellow y (s) | Comfortable stopping distance (m) |
|---|---|---|---|
| 25 | 11.2 | 2.86 | 32 |
| 35 | 15.6 | 3.61 | 56 |
| 45 | 20.1 | 4.35 | 88 |
| 55 | 24.6 | 5.10 | 125 |
At 35 mph: y = 1.0 + 15.65/(2 × 3.0) = 3.61 s. At 25 mph the model gives 2.86 s, which is below the federal MUTCD guidance that yellow intervals be about 3 to 6 seconds. That constraint wins, so the design value is 3.0 s. A good report shows when a constraint, not the model, sets the answer. Missouri goes further than the federal manual: MoDOT’s Engineering Policy Guide makes the 3-second minimum a requirement and times the state’s signals with this same model, using 1.0 s and 10 ft/s2 plus a term for the grade of the approach. Compare your model with MoDOT’s formula for your speed, printed in this lesson’s reading.
Option B: a school-zone speed limit. Suppose a driver can first see a mid-block crosswalk from 30 m away (illustrative sight distance), with tr = 1.5 s and a = 5.0 m/s2 on damp pavement (illustrative). The criterion is that stopping distance must not exceed sight distance: v2/(2a) + trv = 30, or 0.1v2 + 1.5v − 30 = 0. The quadratic formula gives v = 11.37 m/s = 25.4 mph, so a 25 mph limit meets the criterion here, with little margin. MoDOT’s rule for school zones on state highways is a constraint too: a school speed limit is 10 mph below the posted limit and never below 25 mph.
Trade-offs and sensitivity. Every design balances competing goals. A longer yellow reduces red-light running but lengthens every signal cycle. A lower limit shortens stopping distance but slows traffic. Test your design by changing one assumption at a time (reaction time, pavement, approach speed) and report how much the answer moves. State which assumptions are illustrative and which come from a published source.
📖 Read for this lesson
The reading opens over the lesson; close it to come back to exactly where you were. The checks below draw on it.
Formative check
Work through these before moving on. They are not graded — they tell you whether the standard below has landed yet.
Using y = tr + v/(2a) with tr = 1.0 s and a = 3.0 m/s2, what yellow duration does the model give for a 45 mph approach?
In a design report, the federal guidance that yellow intervals be about 3 to 6 seconds is a constraint, and “every approaching driver can either stop comfortably or enter before red” is a criterion.
Stopping distance
Tap to revealv0tr + v02/(2a)
Yellow-interval model
Tap to revealy = tr + v/(2a)
Double the speed
Tap to revealReaction distance ×2, braking distance ×4
Criterion vs constraint
Tap to revealWhat success means vs the limits you must work within
How confident are you that you can specify criteria and constraints and use a stopping-distance model to justify a traffic-safety design value?
Unit 1 checkpoint
Do this before you start the task. It covers the whole unit and tells you what to review first.
On a velocity-time graph, what does the area between the line and the time axis give?
A car’s velocity falls from 20 m/s to 8 m/s in 3.0 s. What is its acceleration?
A graph of x against t2 for a cart starting from rest has slope 0.35 m/s2, so a = m/s2.
Doubling a car’s speed doubles its braking distance.
At 20 m/s with a 1.5 s reaction time and 5.0 m/s2 braking, the stopping distance is m.
Which equation follows from eliminating time from v = v0 + at and Δx = v0t + ½at2?
A velocity of 25 m/s at 53° above horizontal has vx = m/s and vy = m/s.
At the highest point of a projectile’s path, its velocity is zero.
Without air resistance, which launch angle gives the same range as 25° at the same speed?
A ball rolls off a 0.80 m table at 1.5 m/s. It lands m from the table’s base.
In a video lab at 30 fps, why is the time to the farthest mark the most reliable?
In a yellow-light design report, the federal 3-6 s range is a constraint, not a criterion.
Submit: Design Report — Time to Stop (1,000-1,400 words) + five-minute defense
Task: Specify a design value for one traffic-safety question. Build a stopping-distance model from the constant-acceleration equations, state every assumption with its source or label it illustrative, compute your design value, and graph how it changes with one assumption (reaction time, deceleration or speed). Compare your value with the published guidance hosted in this lesson’s reading, Yellow-light guidance: the FHWA MUTCD 3-to-6 second range and MoDOT’s change-interval formula and 3-second minimum for yellow intervals, and for school zones MoDOT’s school speed limit rule (EPG 908.2.5) and the stopping-sight-distance table MoDOT’s Engineering Policy Guide uses (EPG 941.7). Safety: never collect data by standing in or near traffic. Work from the sidewalk, from maps, or from the data in this lesson.
Choose one. All three earn full credit and are the same difficulty.
Option A — your own site. Pick a signalized intersection or a school-zone crosswalk on a Missouri road you know. Read the posted speed from the sign, say whether the approach is level, uphill or downhill, and get the sight distance to the crossing either by pacing it on the sidewalk (count paces, then measure your own pace length) or from the scale bar on any free online map. Set the yellow duration or the speed limit for that site.
Option B — the three sites in this lesson. No internet and no site visit. Each row gives you everything the model needs; pick one row and design for it. These are illustrative sites written for this task, not surveys of real intersections.
| Site | Design question | Approach speed | Sight distance to the crossing | Reaction time tr | Deceleration a |
|---|---|---|---|---|---|
| 1. Mid-block school crosswalk on a flat residential street | Speed limit | 30 mph posted now | 30 m (parked cars block the view) | 1.5 s | 5.0 m/s2, damp pavement |
| 2. School crosswalk on a wide, open arterial | Speed limit | 40 mph posted now | 45 m | 1.5 s | 5.0 m/s2 |
| 3. Signalized intersection, level approach | Yellow duration | 35 mph posted | — | 1.0 s | 3.0 m/s2, comfortable braking |
Checks, so you know you are using the model correctly: site 1 gives 11.4 m/s = 25.4 mph, so a 25 mph limit just meets the criterion; site 2 gives 15.0 m/s = 33.6 mph, so a 30 mph limit meets it with margin; site 3 gives y = 1.0 + 15.65/(2 × 3.0) = 3.61 s. MoDOT’s school-zone rule (10 mph below the posted limit, never below 25 mph) would give 25 mph for site 1 and 30 mph for site 2, so on these sites the published rule and the model agree. Your report still has to show the algebra, the sensitivity graph and the comparison with published guidance.
Option C — the public record. Take your inputs from the stopping-sight-distance table that MoDOT’s Engineering Policy Guide uses when it checks a new entrance onto a state highway (EPG 941.7, which links AASHTO’s Exhibit 3-1); this lesson’s reading reproduces it. Record the design stopping sight distance for three design speeds. Before you read the note under the table, work backward: what reaction time and deceleration would make your own model reproduce the calculated column? Then check your answer against the note. Finally, design for one crossing: a school crosswalk on a state highway that drivers can see from 150 ft (46 m). Find the highest design speed in the table whose sight distance fits, the speed your model allows with the table’s assumptions, and what the engineer should do given MoDOT’s rule that a school speed limit is never below 25 mph. Cite the guide, the section number and the date you read it. If a figure you need is not in the table, say so and use the matching value from Option B’s table, labeled illustrative.
Submission workflow
- Stage 1 — Plan. Your option and site, the design question, a list of criteria and constraints (at least three of each), and the model equations with every input and its source.
- Stage 2 — Reviewed draft. A parent, guardian or other adult reader recomputes your design value, checks units and sources, and tests one assumption (or you do this yourself with the rubric, recomputing the value by a second method); submit the notes and your revision plan.
- Stage 3 — Revised final. 1,000-1,400 words with the model, calculations, a sensitivity graph, a comparison with published guidance and a trade-offs section.
- Stage 4 — Presentation or defense. Five minutes, live or recorded (equal credit): your design value, the evidence for it, one trade-off, and answers to two questions about your assumptions (from your reviewer, or these two: what changes if tr is 2.5 s, and what changes on wet pavement?).
How it is scored
| Criterion | What proficient looks like |
|---|---|
| Criteria and constraints (9-12.ETS1.A.1) | Specific, measurable criteria and realistic constraints, including safety, traffic flow and published limits. |
| Kinematic model (9-12.PS2.A.1) | Reaction and braking stages modeled correctly from the constant-acceleration equations, with units. |
| Mathematical reasoning (SEP.5, MP.4) | Correct calculations, including solving a quadratic or rearranging a formula; answers rounded sensibly. |
| Sensitivity and trade-offs (CCC.3) | Shows how the design value changes with an assumption and weighs at least one trade-off. |
| Use of sources (RST.11-12.7) | Published guidance and data are cited and compared; illustrative values are labeled. |
| Defense (SEP.6) | Explains and justifies the design clearly and answers questions about assumptions accurately. |
How Long a Yellow: The Federal Range, MoDOT’s Formula, and Missouri’s School Speed Limit Rule
FHWA, Manual on Uniform Traffic Control Devices, 11th Edition (December 2023), Section 4F.17; MoDOT Engineering Policy Guide 902.23.7.2 Yellow Change and Red Clearance Intervals, 908.2.5 School Speed Limit Signs, 908.2.6, 908.2.7, and the 941.7 Stopping Sight Distance table (AASHTO Exhibit 3-1); Missouri Department of Revenue, Missouri Driver Guide (revised August 2026); all retrieved November 5, 2026 · SLS original (tables and explanation); cites public government records, statutes and published design values, with brief quotations only. Original: Federal text public domain (work of the U.S. government); brief excerpts from Missouri state government publications reproduced for education with attribution; SLS additions CC BY 4.0
Why this reading. The design report must compare your value with published guidance. Here it is, hosted: the federal range, the formula MoDOT uses to time Missouri’s signals, MoDOT’s rule for school speed limits on state highways, and the stopping-sight-distance table Option C works from. Nothing in this reading needs an internet connection.
1. The federal manual: a range and a rule
The FHWA Manual on Uniform Traffic Control Devices, 11th Edition (December 2023), Section 4F.17, gives the yellow change interval one job and one range.
“The exclusive function of the yellow change interval is to warn traffic approaching a signalized location that their permission to proceed is being terminated after which they will be directed to stop…” (paragraph 01, Support)
“The duration of the yellow change interval shall be determined using engineering practices.” (paragraph 03, Standard)
“A yellow change interval should have a minimum duration of 3 seconds, and a maximum duration of 6 seconds. The longer intervals should be reserved for use on approaches with higher speeds.” (paragraph 13, Guidance)
In MUTCD language a Standard (“shall”) is a requirement and Guidance (“should”) is a recommendation. Federally, the 3-to-6 second range is Guidance. In your report, it is a constraint.
2. How MoDOT times a yellow
MoDOT’s Engineering Policy Guide, section 902.23.7.2, times the yellow and the all-red that follows it with the Institute of Transportation Engineers kinematic model. In the guide’s symbols, the change period (yellow plus all-red) is
CP = t + V/(2a + 64.4g) + (W + L)/V
with t the perception-reaction time (recommended 1.0 s), V the approach speed in ft/s (the 85th-percentile speed from a spot-speed study), a the deceleration (recommended 10 ft/s2), g the grade as a decimal (negative for a downgrade), W the intersection width from the stop line to the far side of the far crosswalk, and L the vehicle length (recommended 20 ft). The first two terms are the yellow; the last is the red clearance. On level ground the yellow term is the lesson’s y = tr + v/(2a), and 10 ft/s2 is 3.048 m/s2, which is why the lesson’s rounded 3.0 m/s2 comes out a few hundredths of a second longer.
Missouri goes one step past the federal manual. In EPG 902.23.7.2 the floor is a Standard: “The yellow change interval shall not be less than three seconds.” The 6-second ceiling stays Guidance. MoDOT also notes that steep downgrades can make the formula give intervals so long that they look unreasonable to drivers, and that the remedy is not to ignore the physics but to add warning signs, advance detection or other measures.
| Approach speed (mph) | Lesson model, a = 3.0 m/s2 (s) | MoDOT yellow, level (s) | Yellow after the 3 s floor (s) | MoDOT yellow, 4% downgrade (s) | MoDOT yellow, 4% upgrade (s) |
|---|---|---|---|---|---|
| 25 | 2.86 | 2.83 | 3.00 | 3.10 | 2.62 |
| 30 | 3.24 | 3.20 | 3.20 | 3.53 | 2.95 |
| 35 | 3.61 | 3.57 | 3.57 | 3.95 | 3.27 |
| 40 | 3.98 | 3.93 | 3.93 | 4.37 | 3.60 |
| 45 | 4.35 | 4.30 | 4.30 | 4.79 | 3.92 |
| 50 | 4.73 | 4.67 | 4.67 | 5.21 | 4.25 |
| 55 | 5.10 | 5.03 | 5.03 | 5.63 | 4.57 |
The columns other than the lesson model are SLS calculations from the EPG formula with t = 1.0 s and a = 10 ft/s2. Read across the 35 mph row, Option B site 3: the lesson’s model gives 3.61 s and MoDOT’s formula 3.57 s on the level, but 3.95 s if the approach runs down a 4% grade. At 25 mph the formula’s 2.83 s is below the 3-second floor, so in Missouri 3.0 s is required. A design report earns its grade by saying which of these numbers governs and why, not by matching one of them.
The all-red. For an illustrative intersection 60 ft wide, the red clearance at 35 mph (51.3 ft/s) is (60 + 20)/51.3 = 1.56 s; at 25 mph (36.7 ft/s) it is 2.18 s. Slow traffic needs longer to clear, which is why MoDOT tells engineers to check the 15th-percentile speed as well as the 85th.
3. Missouri’s school speed limit rule
On state highways, EPG 908.2.5 sets the rule an Option B design must respect. When MoDOT establishes a reduced school speed limit, “The school speed limit shall be 10 mph below the posted speed limit. In no case shall a school speed limit of less than 25 mph be allowed.” The zone should begin at least 200 ft before the school grounds or crossing (more if the school limit is 30 mph or higher) and no more than 500 ft before it, and a School Speed Limit When Flashing sign with a beacon shows when the limit is in force. MoDOT does not post higher-fine signs in school zones, because state law gives no authority for higher speeding fines there (EPG 908.2.6). Cities and counties set limits on their own streets, and the Missouri Driver Guide tells every driver to obey the slower school-zone limit when the lights are flashing or children are present.
Apply the rule to Option B. Site 1 is posted 30 mph: 10 mph lower would be 20 mph, but the floor makes it 25 mph, and the model allows 25.4 mph. Site 2 is posted 40 mph: the rule gives 30 mph, and the model allows 33.6 mph. On these two sites the published rule and the kinematic model agree.
4. For Option C: the stopping-sight-distance table
The table MoDOT links from EPG 941.7 (AASHTO Exhibit 3-1) lists the design stopping sight distance for each design speed. The full table, with its reaction and braking columns and the assumptions printed under it, is in the Lesson 1.3 reading; the rows a school-zone design is likely to use are repeated here (meters are SLS conversions).
| Design speed (mph) | Design stopping sight distance (ft) | (m) |
|---|---|---|
| 15 | 80 | 24 |
| 20 | 115 | 35 |
| 25 | 155 | 47 |
| 30 | 200 | 61 |
| 35 | 250 | 76 |
| 40 | 305 | 93 |
| 45 | 360 | 110 |
EPG 908.2.7 adds a practical fix engineers use when sight distance is short: parking and stopping signs can keep parked or waiting vehicles from blocking drivers’ views of pedestrians in school areas.
Your turn
- Compute MoDOT’s level yellow for 45 mph (66 ft/s) and show it is 4.30 s. Then compute it for a 4% downgrade (4.79 s) and explain, in one sentence, why going downhill needs a longer yellow.
- Option B site 2 is posted 40 mph with a 45 m sight distance. What school limit does EPG 908.2.5 require, what does the model allow, and how much margin is left?
- State the 3-second minimum as a constraint and the change-interval formula as a model, and say which one sets the answer at 25 mph in Missouri.
- Option C: a crosswalk on a state highway can be seen from 150 ft (46 m). Which is the highest design speed in the table whose sight distance fits? What speed does your model allow with 2.5 s and 11.2 ft/s2? Compare both with the 25 mph floor and recommend what the engineer should change.
Sources: FHWA, MUTCD 11th Edition, Part 4 (Section 4F.17) (mutcd.fhwa.dot.gov); MoDOT Engineering Policy Guide, 902.23 Traffic Signal Phasing and Operation (902.23.7.2) (epg.modot.org); MoDOT Engineering Policy Guide, 908.2 Signs (MUTCD Chapter 7B) (908.2.5-908.2.7) (epg.modot.org); MoDOT EPG, Stopping Sight Distance table (AASHTO Exhibit 3-1), 941_SSD.pdf (epg.modot.org); Missouri Department of Revenue, Missouri Driver Guide (revised August 2026) (dor.mo.gov)