4.01 Living with Hazards: Fire, Shaking, Drought and Sea
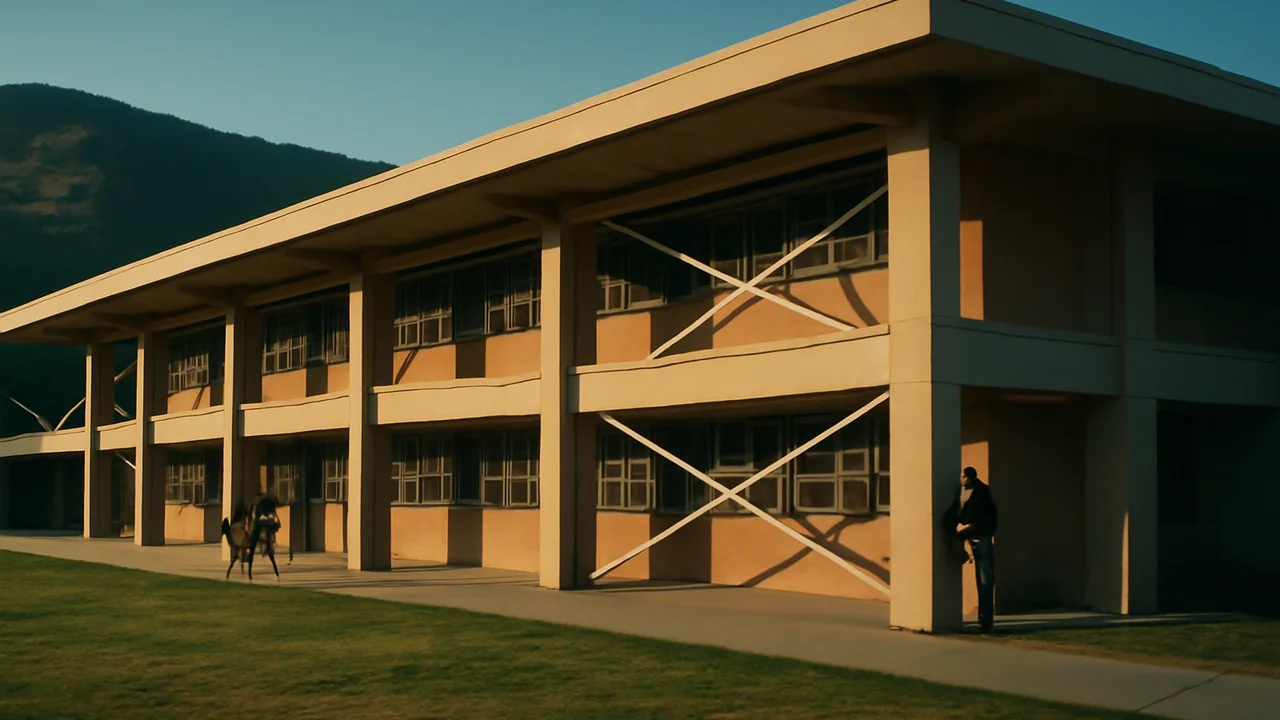
Engineering Resilience for One Foothill Town
How can a community use Earth science and engineering to reduce its risk from hazards and use its resources wisely?
The mystery: A foothill town sits between a forested slope where wind-driven wildfires have destroyed neighboring towns, an active fault under an old downtown, and a paved creek that turns brown with every storm, while it decides where its energy and minerals should come from.
explain, with evidence, how the availability of resources, the occurrence of natural hazards and changes in climate have influenced where people live and how they build, and describe risk as hazard, exposure and vulnerability.
- I can explain how natural hazards, changes in climate, and the availability of natural resources cause changes in population size and migration patterns in human societies.
- I can describe how technology has helped modern civilizations reduce the impact of natural hazards, climate changes, and limited natural resources on human activity.
- I can identify and describe evidence showing how natural hazards have affected human activity and changed population sizes and locations in specific regions.
- I can describe evidence of how changes in climate influence agriculture, human populations, and mass migrations.
- I can explain how the availability of natural resources has shaped features of human societies and provide evidence that human populations depend on technology to obtain resources and modify their environments.
Phase 1: Spark
Warm-Up ~5 min
Do Now. Two towns sit near the same fault. In an earthquake of the same strength, one loses almost no buildings and the other loses many. Write three possible reasons.
A strong earthquake strikes an empty desert, and a moderate one strikes under a city of old unreinforced brick buildings. Which event carries the greater RISK to people?
Instruction ~10 min
The phenomenon, and the people first. In recent decades, wind-driven wildfires have raced from forested hills into foothill towns within hours, destroying whole neighborhoods and taking lives. Survivors have lost homes, schools and jobs, and some towns are still rebuilding. We study the science so that communities can make better choices. If this topic touches your own family’s experience, you can choose a different hazard for your work in this unit.
Resources shaped where people live. People settle where resources are. Gold rushes in several countries drew hundreds of thousands of people to rivers where flowing water had concentrated gold. Water shaped farm valleys (Unit 1), and oil fields built boomtowns. Resource use also brought damage: hydraulic mining, which blasted hillsides apart with high-pressure water, washed so much gravel into rivers that it buried farmland downstream and choked navigation, until courts ordered the dumping stopped.
Hazards shaped how we build. After the 1755 Lisbon earthquake and the fire and tsunami that followed, the city was rebuilt with a flexible wooden frame inside its masonry walls, one of the first building systems designed for earthquakes. The pattern has repeated many times since: earthquakes that collapsed school buildings have been followed by laws setting earthquake standards for schools; earthquakes that broke the ground surface have led to rules that require a geologic study before building across an active fault. Each disaster changed the rules: hazard, loss, response.
Climate is shaping us now. Warmer temperatures dry vegetation earlier in the year and lengthen fire seasons; mountain snowpacks are shrinking (Units 1–3); and rising seas raise the reach of storms along coasts. More homes have been built in the wildland-urban interface, where houses meet flammable vegetation, so more people are exposed. Technology has changed the relationship too: building codes, reservoirs, satellite fire detection and warning systems let people live in places that would once have been too dangerous.
Risk is more than the hazard. Emergency planners describe risk as the combination of three things: the hazard (how likely and how strong the event is), exposure (what people and property are in its path) and vulnerability (how easily they are harmed). Many risk reductions work on exposure and vulnerability, which people can change, rather than on the hazard itself.
Worked example: expected annual loss (illustrative numbers). Suppose a neighborhood has a 2% chance each year of a flood that would cause $50 million in damage. Its expected annual loss is 0.02 × $50,000,000 = $1,000,000 per year. A levee upgrade costing $3 million that prevents 60% of that loss saves about 0.6 × $1,000,000 = $600,000 a year, or $18 million over 30 years (ignoring interest). The benefit-cost ratio is 18 / 3 = 6. A ratio above 1 means the benefits exceed the costs. A 2019 national study in the United States estimated that, on average, federally funded hazard-mitigation grants saved about $6 for every $1 spent.
Your questions. Aim them at choices: Which risks can a community reduce most cheaply? Who decides, and who pays?
Reading: Steven Earle, Physical Geology, 2nd ed., chapters 11 and 20 (CC BY 4.0).
Guided Exercises ~15 min
Work with your table group.
Independent Practice ~10 min
Start your Resilience Notebook.
Build a timeline of at least five events, from anywhere in the world or your own region, in which a resource, a hazard or a change in climate changed how people lived, moved or built. For each, name the Earth-science cause and the human response.
Write two investigable questions for the class Wonder Board about reducing risk in a town like our client's.
Closure ~5 min
Resources draw people in; hazards push back; engineering changes the terms. Next lesson we meet a town that needs all three.
How confident are you that you can I can explain how resources, hazards and climate have shaped human activity and describe risk.
Exit ticket: define risk in your own words, and give one example of lowering it without changing the hazard.
Teacher notes
Materials: printed satellite image pair of a recent wildfire (any well-documented large fire), timeline strips, chart paper for the Wonder Board.
Setup: open the lesson by acknowledging that wildfire, earthquake and flood losses are real and recent. Let any student who has lived through a disaster choose a different hazard. The $6-per-$1 figure is from a 2019 national mitigation study; the flood example is illustrative.
Listen for: “risk equals magnitude”; blaming people for where they live; disasters described as purely natural.
Support / stretch: give a hazard / exposure / vulnerability sorting card set. Stretch: research one hazard-loss-response sequence and cite two sources.