1.06 One Model of the Whole Valley: Feedbacks, Evidence and Ideas
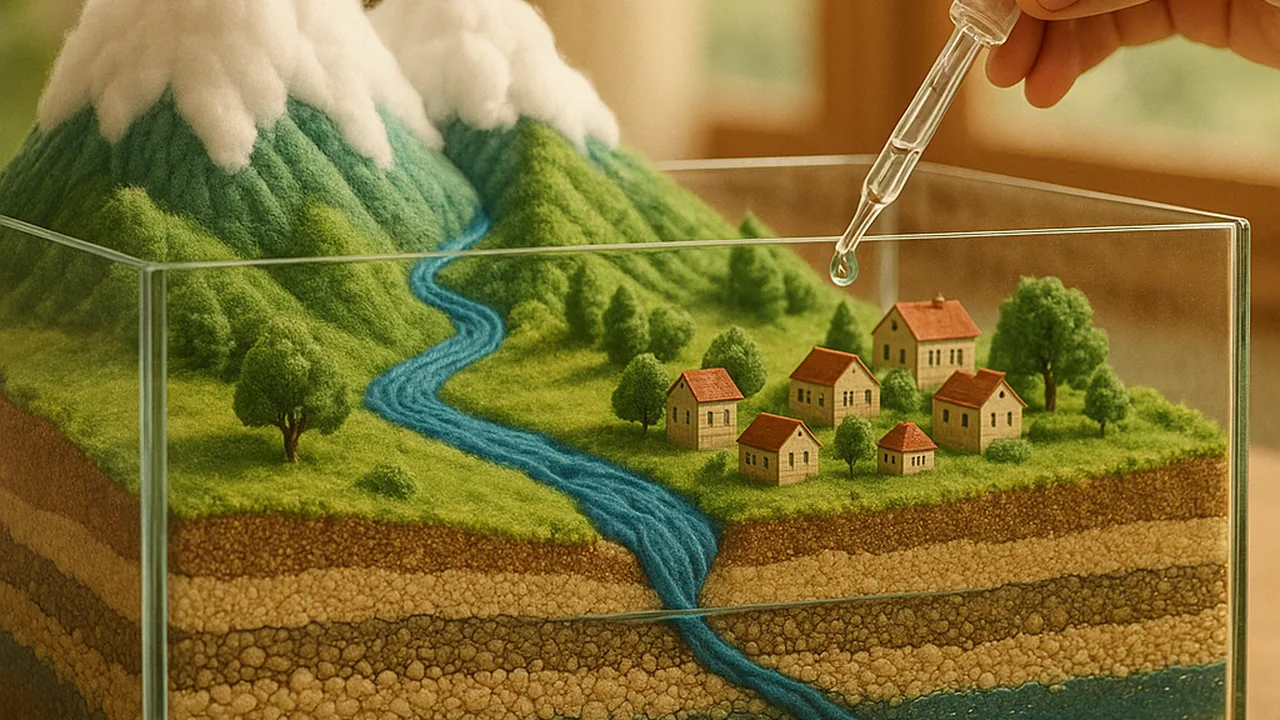
revise a system model of the valley that links snow, surface water, groundwater, the ground and people, explain its feedbacks and the uncertainty in our data, and brainstorm solutions for the district.
- I can use analyzed data to describe how feedback between two Earth systems works and explain whether the feedback is positive (increasing the original change) or negative (decreasing the original change).
- I can explain how variation or uncertainty in the data, such as limitations, accuracy, or bias, might affect how I interpret the data.
- I can compare my simulation results to real-world examples and determine how realistic my simulation is.
Phase 3: Make Sense
Warm-Up ~5 min
Do Now. Look back at the system model you drew in 1.01. Circle one thing you now know is wrong or missing, and write what you would change.
Pumping lowers the water table, clay compacts and storage capacity shrinks, so next drought the basin runs dry sooner and pumping rises again. What kind of feedback is this?
Instruction ~10 min
Pulling it together. In four lessons we gathered evidence from reservoir and snowpack data, a porosity lab, a subsidence model and a computational basin. Today each team revises one system model that explains the whole valley.
Revised model checklist. Stores: snowpack, reservoirs, rivers and canals, the aquifer (sand and gravel), the clay aquitards, the creek. Flows: snowmelt, releases, recharge, pumping, outflow to the creek. People and technology: wells, canals, managed recharge. At least one reinforcing feedback and one balancing feedback, each with evidence.
Worked example 1: a balancing feedback. Priya’s team added: “As the water table falls, pumping costs more energy because water must be lifted farther, so some farmers pump less.” The change (falling water table) produces a response (less pumping) that reduces the change. That is a balancing, or negative, feedback. Note that it acts only slowly and only for some farms.
Worked example 2: how sure are we? Diego listed the uncertainty in each data set. The porosity lab had packing differences of a few mL between trials. The sponge model is far smaller and softer than real clay. The benchmark record is sample data with no error bars. Recharge is the hardest flow to measure in any real basin, so a model’s recharge number may be off by a large fraction. Limitations, accuracy and possible bias do not make data useless; they tell us how strongly we can state a conclusion.
Worked example 3: is the simulation realistic? Compare model behavior with what is documented in real overdrawn basins: falling water tables in drought, partial recovery in wet years, and permanent subsidence where clay is thick. If the model never shows recovery after wet years, something in it is wrong.
CER with sentence starters. Claim: “The valley’s land is sinking mainly because…” Evidence: “Our model showed… The benchmark record showed…” Reasoning: “This happens because clay… so the feedback is…”
Ideate. Now flip from explaining to designing. Brainstorm at least six strategies the district could use, without judging yet. Push past the obvious: pumping allocations, managed recharge basins, drip irrigation, letting some fields rest in dry years, recycled wastewater for farms, capturing storm runoff, metering wells, and paying farmers to switch crops are all used somewhere. Each idea must name the part of the system it changes.
Guided Exercises ~15 min
Revise your team’s model, then work through the cards.
Independent Practice ~10 min
Write and brainstorm.
CER: why is the valley's land sinking, and why won't refilling the aquifer fully fix it? Use evidence from two lessons and name one feedback, saying whether it is reinforcing or balancing. Add one sentence on the uncertainty in your evidence.
Ideate: list at least six strategies for the district. For each, name the part of the system it changes and one stakeholder it helps.
Closure ~5 min
We can explain the valley. Next phase we choose and prototype a plan.
Exit ticket: which brainstormed strategy are you most curious to test in the model, and what result would convince you it works?
Teacher notes
Materials: each team’s 1.01 model, chart paper, sticky notes in two colors (feedbacks and ideas), the 1.03–1.05 data.
Listen for: calling every feedback “positive” because it sounds good or bad; ignoring uncertainty; brainstorming that stops at “use less water.”
Support / stretch: give the model checklist as a printed frame. Stretch: draw a loop diagram with plus and minus signs on every arrow.