2.08 Critique, Test and Tile Version 2
run a gallery critique, test the tile against every criterion, judge the accuracy and precision of our data, and build an improved version 2.
- I can collect and record data that shows the effect of a property of water on Earth’s materials or surface processes.
- I can evaluate how accurate and precise my collected data is.
- I can revise my investigation plan to improve the accuracy and precision of my data if needed.
Phase 4: Build
Warm-Up ~5 min
Do Now. Two teams tested the same white tile. One got a rise of 9 °C, the other 14 °C. List three reasons that could explain the difference.
If our tile meets C1 once, we can be confident it always will.
Instruction ~10 min
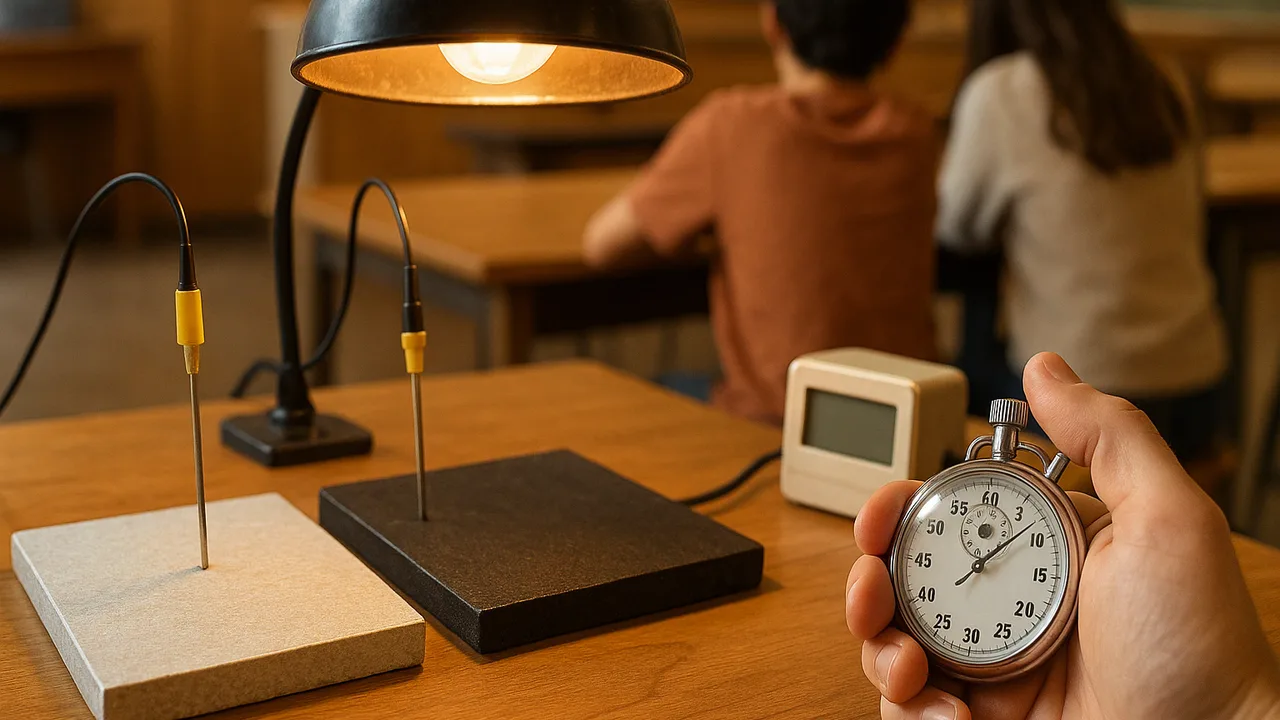
Class criteria and constraints (set in 2.07, used through 2.09). Each team’s model schoolyard tile (10 cm × 10 cm) sits 25 cm under the class heat lamp for 15 minutes, beside a bare black “blacktop” tile. (C1) Its surface temperature rise is at most 60% of the blacktop tile’s rise. (C2) It stays safe to walk on: firm, with no standing water. (C3) 10 minutes after the lamp is off, it is no warmer than the blacktop tile. Constraints: (K1) no more than 50 mL of water per test, because water is scarce; (K2) no more than 10 sample budget points of materials; (K3) the design must work all year, not just in summer.
Gallery critique. Teams display V1, their data table and their matrix. Visitors leave I like… (with evidence), I wonder… (about a criterion or the data) and What if… (a specific change) notes. Every note names a criterion.
Test. Run V1 three times beside the blacktop control, with the tile cooled to room temperature between runs. Then make one change, build V2, and run it three times.
| Test | V1 (mean of 3) | Meets? | Change for V2 | V2 (mean of 3) | Meets? |
|---|---|---|---|---|---|
| C1 rise as % of blacktop | |||||
| C2 firm, no standing water | |||||
| C3 10 min after lamp off vs blacktop | |||||
| K1 water used (mL) | |||||
| K2 budget points |
Worked example 1 (sample data): accuracy and precision. Jamal’s three V1 rises were 9.5, 13.0 and 10.0 °C beside blacktop rises of 20.5, 21.0 and 20.0. The second run had the thermometer tip touching the paint in one spot and sitting slightly above it in another. Taping the thermometer flat gave V2 trials of 10.0, 10.5 and 9.5: much more precise. To check accuracy, the team read a cup of ice water (0 °C) with each thermometer before testing.
Worked example 2 (sample data): version 2. Ava’s Damp Pavers V1 rose only 30% as much as blacktop, but used 80 mL of water (fails K1) and was 1.5 °C warmer than blacktop 10 minutes after the lamp went off (fails C3). Critique asked, “What if the top were white?” V2, a white porous top over a sponge with 40 mL of water, rose 35% as much as blacktop and was cooler after the lamp went off. It meets every criterion: a hybrid won.
Back to the planet. The same three levers on a tile, reflecting, shading and evaporating, act on Earth’s whole energy budget: more reflective ice and cloud, or more greenhouse gases slowing the escape of infrared, change the balance and with it temperature, rainfall, ice and sea level.
Guided Exercises ~15 min
Critique, test, then answer.
Independent Practice ~10 min
Build and test V2, then reflect.
Complete the V1 and V2 test table. Explain your change with the energy budget, and judge whether your data are precise and accurate enough to recommend the design to the department.
Revise your test plan: name one change that would make the next round of data more accurate or more precise.
🔎 Mini case study: Cool roofs in a big city ~8 min
Since 2010, New York City has run a program, NYC CoolRoofs, that coats rooftops with a white reflective coating, often using trained workers and volunteers. Dark roofs absorb most sunlight and can get far hotter than the air; white coatings reflect most of it, lowering roof temperatures and the energy buildings need for cooling. Programs like this treat the city as an energy budget: raising the albedo of millions of square meters of roof reduces the energy absorbed, which is one tool cities use against the urban heat island. Cities also weigh trade-offs, such as coatings that need recoating over time and a small extra heating need in winter.
Think about it: Which of our four schoolyard designs works most like a cool roof, and which criterion or constraint would a city check first before using it on schoolyards?
Closure ~5 min
V2 is tested against every criterion. Next phase: explain the two climates and present the design to the department.
How confident are you that you can I can test a design against criteria, judge the accuracy and precision of my data and improve the design.
Exit ticket: what changed from V1 to V2, and what did the data say about it?
Teacher notes
Materials: the 2.07 kit, ice water for calibration, sticky notes in three colors, a timer. Cool tiles to room temperature between runs (a fan helps).
Facts to keep careful: the case study names the program and its start year only; check the NYC CoolRoofs pages before adding any figures. Jamal’s and Ava’s results are sample data.
Listen for: V2 changes not tied to a critique or failed criterion; ignoring the control.
Support / stretch: a menu of V2 changes. Stretch: graph each team’s V2 temperature curve and estimate the cooling rate after the lamp goes off.