1.03 Porosity and Permeability: How Aquifers Hold Water
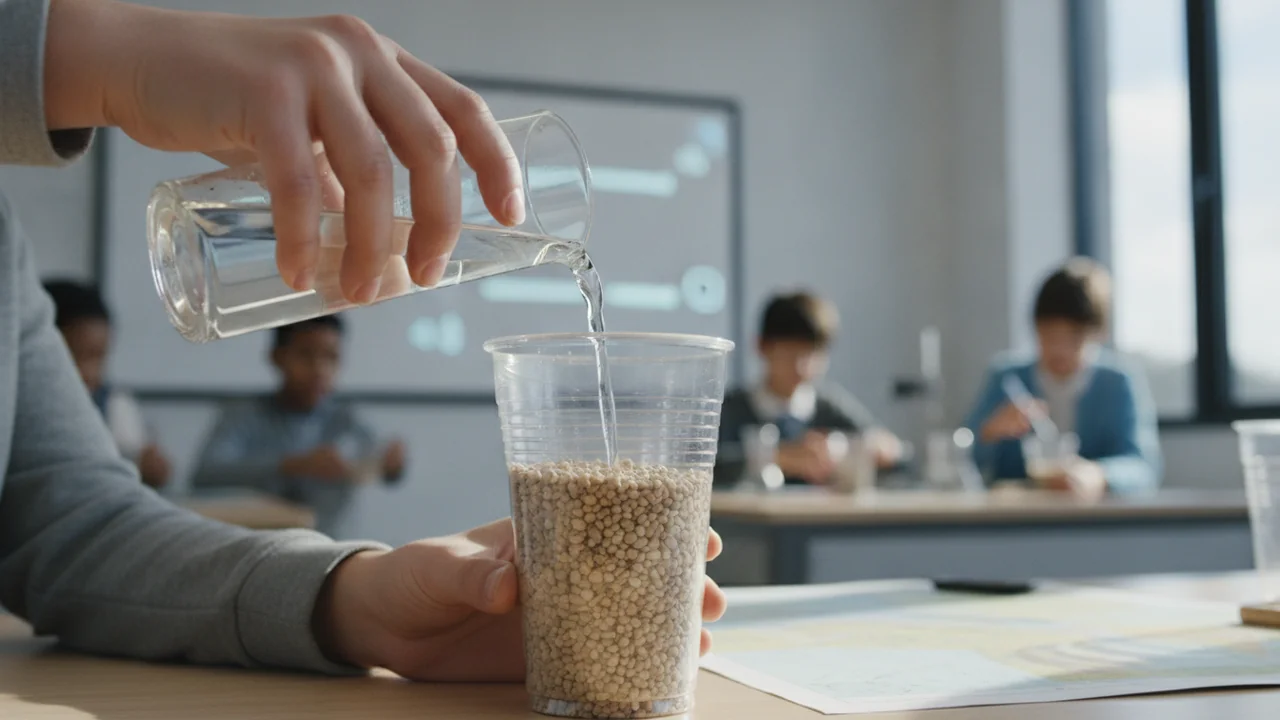
plan and carry out an investigation that measures the porosity and permeability of gravel, sand and soil, and explain how grain size and sorting control how much water an aquifer stores and how fast water moves through it.
- I can plan an investigation that includes collecting data about the heat capacity, density, and polarity of water.
- I can explain how the properties of water affect energy transfer, temperature patterns, air movement, and water movement at Earth’s surface.
- I can identify and plan to collect data showing the mechanical and chemical effects of water on Earth materials, such as erosion, weathering, and changes in rock.
- I can collect and record data that shows the effect of a property of water on Earth’s materials or surface processes.
- I can evaluate how accurate and precise my collected data is.
Phase 2: Investigate
Warm-Up ~5 min
Do Now. A jar of marbles and a jar of fine sand are both “full.” Which jar has more empty space between its grains? Which would let water pour through faster? Write a guess and a reason for each.
Clay-rich soil, sand and gravel each fill a 100 mL cup. Which will hold the MOST water in its pore spaces?
Instruction ~10 min
Water underground. Groundwater is not an underground lake. It fills the tiny spaces between grains of sand and gravel and the cracks in rock, like water in a sponge. Below the water table every space is full: this is the saturated zone. A layer of rock or sediment that stores and transmits enough water to supply a well is an aquifer. In many dry farming regions groundwater supplies a large share of the water people use, and in drought years much more.
Porosity: how much water fits. Porosity is the fraction of a material’s volume that is open space: porosity = pore volume / total volume. Worked example 1. A cup is filled to 100 mL with dry gravel. Water is poured in until it just reaches the top of the gravel, and 38 mL are needed. Porosity = 38 / 100 = 0.38, or 38%. Well-sorted sand and gravel usually have porosities of about 25–40%. Clay can have even higher porosity, 40–60%, because its tiny flat particles stack loosely. Solid granite may have less than 1%, except where it is fractured.
Permeability: how easily water moves. Permeability is how readily a material lets water flow through it. It depends on the size of the pores and how well they connect, not just on how many there are. Gravel has large, connected pores, so water pours through. Clay has high porosity but tiny pores in which water clings to the grains, so water barely moves: clay is nearly impermeable. Layers of clay act as aquitards, confining the aquifers below them. Water’s polarity is the reason it clings: its slightly charged ends are attracted to mineral surfaces.
Sorting matters. A well-sorted sediment has grains of similar size. A poorly sorted one mixes sizes, so small grains fill the spaces between large ones and both porosity and permeability drop. That is why river gravels, sorted by flowing water, make some of the best aquifers.
Worked example 2: how much water is that? Not all pore water drains out; some clings to grains. The fraction that drains is the specific yield. Suppose an aquifer under 1 km2 of farmland has a specific yield of 0.20 and the water table falls by 1 m. The water removed is 1,000,000 m2 × 1 m × 0.20 = 200,000 m3, or 200,000 / 1,233 ≈ 162 acre-feet. Where water tables have fallen tens of meters across a whole valley, the volumes are enormous.
Lab: Measuring porosity and permeability of aquifer materials. Question: which material, gravel, sand or soil, stores the most water, and which lets water flow through it fastest? Work in teams of four; each member records the data in their own notebook. Keep the sample volume, the water volume and the container the same for every material, and repeat each measurement.
- Porosity: fill a solid cup to the 100 mL mark with dry gravel, tapping it gently to settle. Slowly pour water from a full graduated cylinder into the gravel until the water just reaches the top surface. Record the volume added.
- Repeat for sand and for soil, using the same 100 mL volume. Repeat each material twice with fresh dry samples.
- Permeability: fill a cup with small holes in its bottom with 100 mL of each dry material and hold it over an empty cup. Pour 100 mL of water onto the surface all at once and start the stopwatch.
- Stop the watch when water stops dripping steadily (no drip for 5 seconds). Record the drain time and the volume collected in the bottom cup.
- Compute porosity = water added / 100 mL, and water retained = 100 mL − water collected. Graph porosity and drain time for the three materials.
| Material | Water added to fill pores (mL), trial 1 | Trial 2 | Porosity (%) | Drain time (s) | Water collected (mL) | Water retained (mL) |
|---|---|---|---|---|---|---|
| Gravel | ||||||
| Sand | ||||||
| Soil |
No materials? Use the illustrative results. 100 mL of each dry material, 100 mL of water poured on all at once. These are constructed teaching numbers, not real measurements; compute porosity and retained water yourself.
| Material | Water to fill pores (mL), trial 1 | Trial 2 | Drain time (s) | Water collected below (mL) |
|---|---|---|---|---|
| Aquarium gravel | 41 | 39 | 6 | 92 |
| Play sand | 33 | 31 | 38 | 74 |
| Clay-rich garden soil | 47 | 45 | 315 | 31 |
Kitchen option. Run the same method on dry rice, dried beans and granulated sugar, a grain-size series like gravel, sand and silt. Explain why sugar, with the smallest grains, does not behave like clay.
Guided Exercises ~15 min
Answer during and after the lab. Use your own data where you can.
Independent Practice ~10 min
Write the lab conclusion in your Basin Notebook.
CER: which material would make the best aquifer for the district's wells? Use both porosity and drain time as evidence, and explain your reasoning with pore size, connection and water clinging to grains.
Estimate the specific yield of your sand as water collected / 100 mL. Judge whether your cup data can be used to say how a real aquifer behaves, and name one limit of the model.
Closure ~5 min
Gravel and sand store and pass water; clay holds it tight. Next lesson: what happens to clay layers when wells pull the water out.
How confident are you that you can I can measure porosity and permeability and explain how they control an aquifer.
Exit ticket: did the material with the highest porosity also drain fastest? Explain why porosity and permeability are different properties.
Teacher notes
Timing: this lab spans two 50-minute periods: day 1 plan, porosity and permeability runs; day 2 graphing, error analysis and the CER.
Materials (per team): about 300 mL each of dry aquarium gravel, play sand and clay-rich garden soil; three solid cups and three cups with small holes punched in the bottom; a 100 mL graduated cylinder; stopwatch; tray; paper towels; goggles.
Listen for: “more holes means faster flow” (pore size and connection matter more than total space); confusing precision with accuracy.
Support / stretch: give the data table pre-labeled and a calculator. Stretch: test a poorly sorted mix of gravel and sand and predict its results first. Reading: Earle, Physical Geology, chapter 14.