2.02 Project Brief and Wonder Board: The Cool Schoolyard Challenge
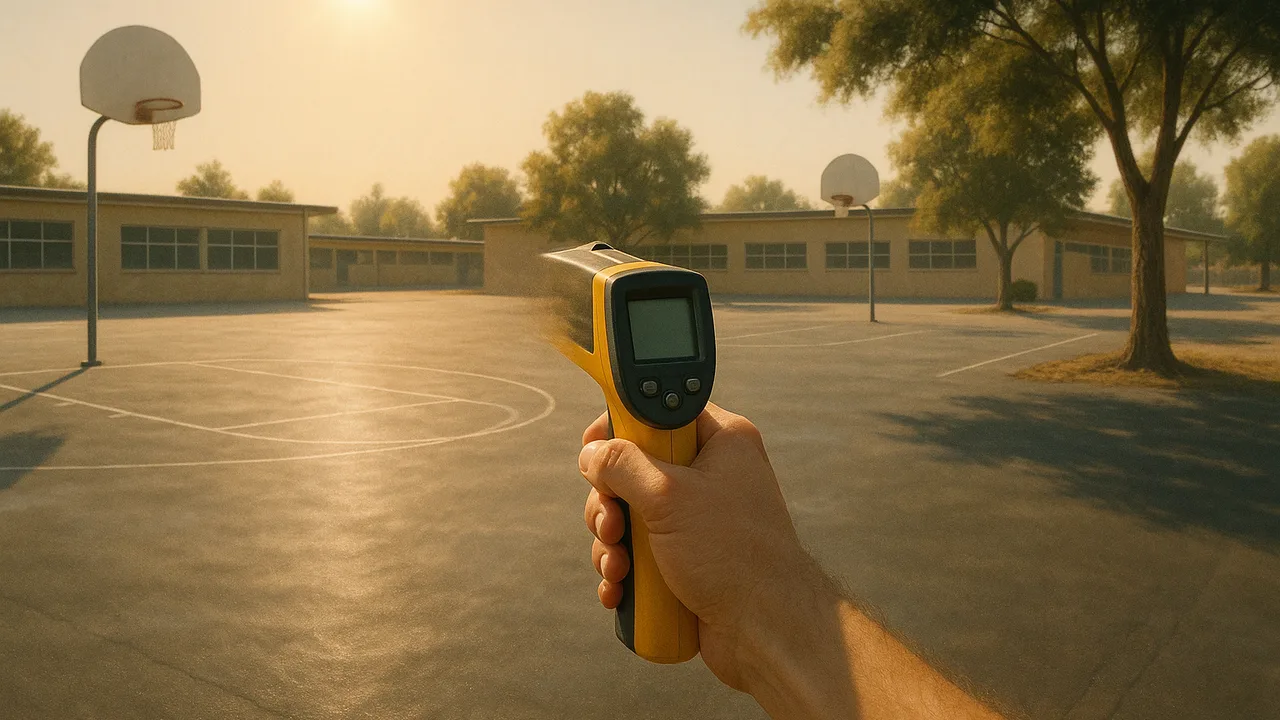
The Cool Schoolyard Challenge
Why do places a short drive apart have such different climates, and how can we redesign a schoolyard’s energy budget to keep it cooler?
The mystery: On the same July afternoon a coastal town sits in cool fog while a city about 120 km inland bakes, yet in January the two have almost the same temperatures.
Questions we will figure out together in this unit:
- Why does the coast stay cool in summer when it gets the same sunshine?
- Why does water take so long to warm up?
- How much hotter is blacktop than the air above it?
- What causes the fog to form along the coast?
- Can a surface be cool without using a lot of water?
- Do greenhouse gases make our hot afternoons hotter?
- How do scientists know what changes Earth’s climate?
- Will a cooler surface still work in winter?
explain the facilities department’s problem, the driving question and our need-to-knows, and sort the factors that heat a schoolyard into energy in, energy out and energy stored or moved.
- I can organize the factors in a climate model into groups based on whether they affect energy input, energy output, or energy storage and redistribution in Earth’s systems.
Phase 1: Spark
Warm-Up ~5 min
Do Now. Think of a hot afternoon. Where at school was it hottest underfoot, and where was it coolest? Write the two places and one guess about why.
On a sunny afternoon, which surface will be hottest to touch?
Instruction ~10 min
Our client. The school facilities department of Inland City. Its schoolyards are mostly dark blacktop, and in late spring and early fall the play areas get too hot for recess some afternoons. The department has asked our class to explain why the city is so much hotter than the coast in summer, and to design a cooler schoolyard surface it can test before rebuilding a yard.
The brief. The department wants (1) a clear explanation, for families, of why Inland City is so much hotter than Coastal Town in summer, built on data and an energy model; and (2) a tested design for a cooler schoolyard surface that uses little water, fits a budget and works all year.
Driving question. Why do places a short drive apart have such different climates, and how can we redesign a schoolyard’s energy budget to keep it cooler?
A schoolyard is a tiny climate system. Every surface follows the same accounting as a whole planet: energy in (sunlight, by angle and hours), energy out (reflected light and emitted infrared), and energy stored or moved (warming the surface material, evaporating water, wind carrying heat away).
Worked example 1: sorting factors. Diego sorted seven schoolyard factors. Energy in: sun angle, hours of sun, shade from a tree or sail. Energy out: surface color (reflection), infrared emitted by the hot surface. Stored or moved: the material’s heat capacity, water evaporating from soil or plants, wind.
Worked example 2: sample surface data. A city crew measured surfaces on one sunny 33 °C afternoon (sample data): blacktop 61 °C, light concrete 47 °C, artificial turf 63 °C, grass 36 °C, shaded blacktop 38 °C. Same sunshine, same air: a nearly 30 °C spread from the surfaces alone. These are sample numbers shaped like published surface surveys.
Teams and roles. Teams of four rotate roles: Climate Analyst (data and graphs), Lab Lead (setup, timing, safety), Design Lead (sketches, budget, build) and Communicator (client updates and the final presentation).
Guided Exercises ~15 min
Use the brief and the sample surface data.
Independent Practice ~10 min
Build the team’s need-to-know board.
Write at least eight need-to-knows in three groups: climate science, schoolyard design, and people. Star the three that matter most.
Sort every factor from the sample surface data into energy in, energy out, or energy stored or moved, and explain one placement.
Closure ~5 min
Client, brief and teams are set. Next phase: why does water keep the coast mild? We heat sand and water side by side.
Exit ticket: restate the department's problem in one sentence that names who is affected and what a good design must do.
Teacher notes
Materials: printed brief, role cards, chart paper, sticky notes, optional infrared thermometer for a quick schoolyard walk (sun-safe, 10 minutes).
Setup: if a district facilities manager can visit or send a short video, use it. The surface temperatures are sample data; if you have an infrared thermometer, measure your own yard and compare.
Listen for: confusing air temperature with surface temperature; “just add sprinklers” with no thought for water.
Support / stretch: sorting cards for the factor activity. Stretch: link back to Unit 1: why does a water-hungry cooling design conflict with an overdrawn basin?