1.02 Project Brief and Wonder Board: The Overdrawn Basin
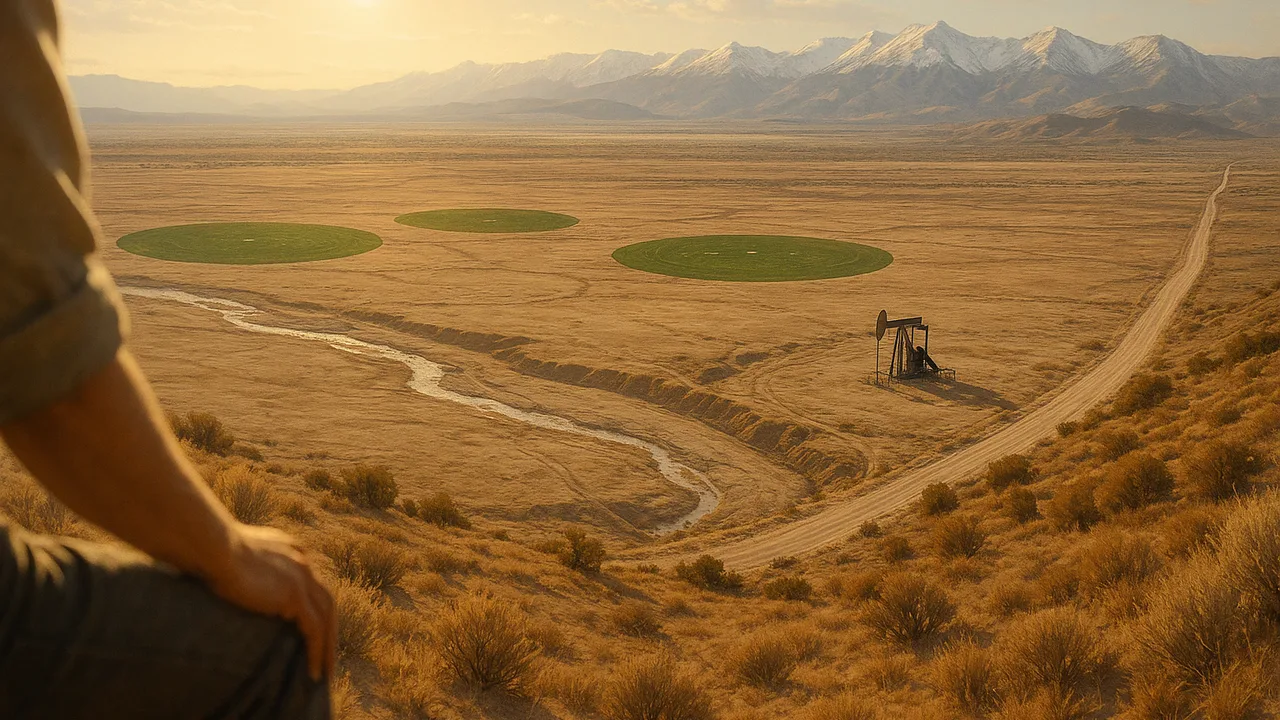
A Water Plan for One Basin
How should an overdrawn groundwater basin be managed so it can supply people, farms and ecosystems for the long term?
The mystery: In some years a mountain range’s spring snowpack holds only a small fraction of its average; in the drought that follows, a hot farm valley pumps so much groundwater that its water table falls, shallow wells go dry and the valley floor sinks.
Questions we will figure out together in this unit:
- How does water get from the mountains into the ground under the valley?
- How much water can sand or gravel hold?
- Why does the ground sink when wells pump, and can it rise again?
- How fast is the basin’s storage falling?
- Could we put water back underground in wet years?
- What happens to the creek and its fish if the water table falls?
- Who decides how much each farm or town can pump?
- How do scientists know a plan will work before they try it?
explain the groundwater district’s problem, the driving question and our need-to-knows, and describe how water availability and technology have shaped where people in the valley live and farm.
- I can explain how natural hazards, changes in climate, and the availability of natural resources cause changes in population size and migration patterns in human societies.
- I can describe how technology has helped modern civilizations reduce the impact of natural hazards, climate changes, and limited natural resources on human activity.
- I can analyze data to identify how human activities or specific technologies affect Earth’s systems.
Phase 1: Spark
Warm-Up ~5 min
Do Now. A farm valley gets only about 20 cm of rain a year, yet it grows fruit, nuts and vegetables for millions of people. Write down every source of water you think its farms could use.
What usually happens to a valley's groundwater when its wells pump more each year than rain and rivers put back?
Instruction ~10 min
Our client. The board of a farm valley’s groundwater management district. The valley is hot and dry in summer, its crops depend on wells, and its groundwater basin has been overdrawn for years. Some domestic wells have gone dry and the ground near the canal is sinking. The board has asked our class for an evidence-based water plan it can take to the public.
The brief. The district’s letter lists what it needs: a plan that keeps groundwater storage from falling over 20 years, stops more land sinking, keeps safe drinking water in every household’s well, leaves water in the valley’s spring-fed creek for fish and birds, and does not shut down the valley’s farms. Our plan must be built on a model and tested before anyone tries it on the real valley.
Driving question. How should an overdrawn groundwater basin be managed so it can supply people, farms and ecosystems for the long term?
Water shaped the valley. The availability of a resource shapes where people live. Towns, crops and jobs grew where water could be reached: first beside rivers, then along canals, then wherever pumps could reach the aquifer. Technology widened the map. Electric pumps, deep wells and long canals let people farm land that rain alone could never water. Technology also changes how hazards and shortages affect people: storage reservoirs carry a valley through a dry year that would once have forced families to move.
Worked example 1: a need-to-know list. Mei’s team read the brief and sorted their questions. Science: How does water get into the ground? How much is down there? Why does the ground sink? Data: How fast is storage falling? Design: What strategies exist, and what do they cost? People: Who is affected by each choice? A good need-to-know list mixes all four.
Worked example 2: an unintended effect. Deep wells were built to give farms a steady supply. One unintended effect was that shallow household wells nearby went dry as the water table fell below them. Technology that solves one problem can create another in a different part of the system.
Teams and roles. Teams of four rotate roles each week: Hydrogeologist (keeps the science accurate), Data Analyst (tables, models and graphs), Community Liaison (keeps every stakeholder’s needs in view) and Project Manager (timeline, materials and the final submission).
Guided Exercises ~15 min
Use the client’s brief. Discuss each card before you answer.
Independent Practice ~10 min
Build the team’s need-to-know board.
Write at least eight need-to-knows, two in each group: science, data, design and people. Star the three your team thinks matter most.
In one paragraph, explain how technology has changed the way the valley's people depend on water, using one benefit and one unintended effect.
Closure ~5 min
Client, brief, driving question and teams are set. Next phase we go underground: how do sand, gravel and clay hold water?
Exit ticket: restate the district's problem in one sentence that names who is affected and what the plan must achieve.
Teacher notes
Materials: printed client brief, role cards, chart paper for need-to-know boards, sticky notes for the Wonder Board.
Setup: the client is generic. If your area has a water utility or conservation district that will send a speaker or a short video, use it, but keep the project valley generic. The 20 cm rainfall figure describes a dry farm valley in general, not a measured place.
Listen for: treating farmers or towns as villains; need-to-know lists with no data or people questions.
Support / stretch: provide question stems for each of the four groups. Stretch: research one real region where water availability caused people to move, and bring one source to 1.04.