1.04 Groundwater and the Sinking Valley
construct an explanation, from historical and physical evidence, of how the availability of water has shaped settlement and farming in a dry valley, and argue from evidence about how groundwater should be managed.
- I can identify and describe evidence showing how natural hazards have affected human activity and changed population sizes and locations in specific regions.
- I can describe evidence of how changes in climate influence agriculture, human populations, and mass migrations.
- I can explain how the availability of natural resources has shaped features of human societies and provide evidence that human populations depend on technology to obtain resources and modify their environments.
- I can use reasoning and evidence, along with the assumption that scientific laws and theories remain consistent over time, to describe how natural hazards, climate changes, and resource availability affect population size and migration patterns.
- I can explain how technology has changed the cause-and-effect relationship between human society and natural hazards, climate, and natural resources.
- I can use analyzed data to describe an unexpected or unintended effect of a technology on Earth’s systems.
Phase 2: Investigate
Warm-Up ~5 min
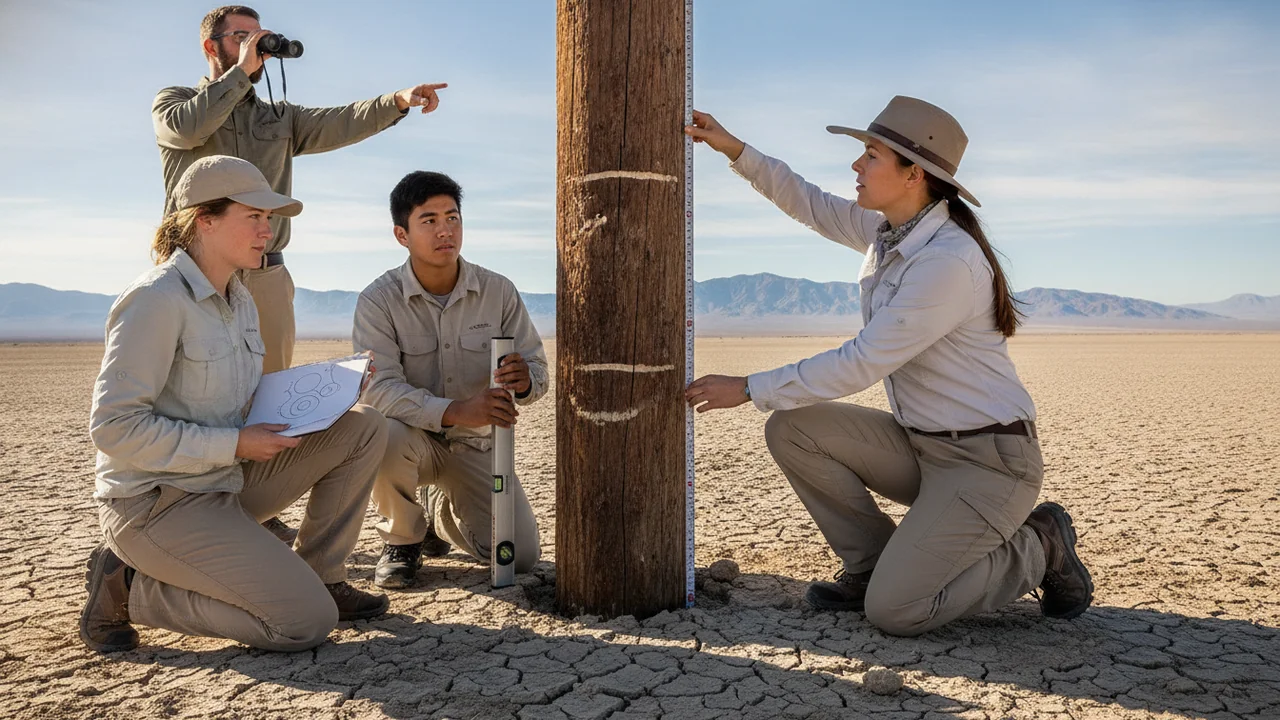
Do Now. A photo shows a tall utility pole in a farm field. Signs nailed up the pole mark where the ground surface used to be in earlier decades, and the highest sign is far above a student’s head. Write what you think happened to the ground, and one cause you suspect.
A sponge and a flat layer of clay are soaked, stacked under a weight, drained and then soaked again. What happens to the clay?
Instruction ~10 min
Water made the valley. Picture a hot agricultural valley that gets only about 15–28 cm of rain a year across much of its floor, yet is one of the most productive farming regions in its country. That happens because people found water elsewhere: first in rivers fed by mountain snowmelt, then in long canals, and, in huge amounts, underground. Towns, crops and jobs grew where water could be reached. This is a clear case of the availability of a natural resource shaping where and how people live.
Pumping and the land. Through the twentieth century, electric pumps in valleys like this drew water from deep aquifers faster than rain and rivers could recharge them. Water tables fell. Then the land itself began to sink. Survey markers and old utility poles in sinking farm valleys around the world record the ground falling by several meters over a few decades.
Why the ground sinks. Many valley aquifer systems are layered sand and clay. When water is pumped out, the water pressure that helped hold the grains apart drops, and the weight of the overlying sediment squeezes the clay layers. Sand springs back when water returns, but clay compacts permanently: its flat particles rearrange into a tighter stack. This is land subsidence, and the permanent part cannot be undone by refilling the aquifer, because the space that held water is gone. Subsidence can bend canals so they carry less water, and it damages wells, bridges and roads.
The drought years. When surface-water deliveries are cut in a drought, pumping rises again. Satellite radar can measure the ground sinking by several centimeters in a few months in the worst-hit areas. Domestic wells, usually shallower than farm wells, are the first to go dry, often in small rural communities. A deep well that solves one farm’s shortage can be the cause of a neighbor’s dry tap: an unintended effect of the technology.
A response. Many regions now require local agencies in overdrawn basins to write plans that bring groundwater use into balance within a set number of years, avoiding results such as chronic lowering of water tables and significant subsidence. This is an engineering and policy problem as much as a science problem: cutting pumping protects the aquifer but can take farmland out of production and cost jobs.
Worked example: rates from data (sample data). A benchmark in the valley was 3.20 m above a fixed reference in 2010 and 2.60 m above it in 2016. It sank 0.60 m in 6 years, 10 cm per year. Comparing rates between drought and wet years is strong evidence that pumping, not natural settling, drives the sinking. Watch the logic: two things changing together is a correlation; the clay-compaction mechanism plus the drought-year pattern is what makes it a cause.
Lab: Squeezing an aquifer, a sponge-and-clay model. Question: does removing water from a compressible layer make the surface sink, and does it recover when water returns?
- Soak two kitchen sponges. Stack them with a flattened 1 cm layer of modeling clay between them, set a flat card on top, and measure the stack’s height at the card’s corners; average them.
- Place a stack of books or a 1 kg bag of rice on the card and wait 30 seconds. Measure again.
- Tilt the tray and press gently at the sponge edges to drain water (“pumping”). Measure with the weight on.
- Return the stack to water for 2 minutes (“recharge”) with the weight still on, and measure again.
- Remove the weight, inspect the clay layer and measure its thickness.
| Stage | Stack height (mm) | Change from start (mm) | Clay thickness (mm) |
|---|---|---|---|
| Saturated, no weight | 0 | 10 | |
| Saturated, with weight | |||
| Drained (“pumped”) | |||
| Re-wetted (“recharged”) |
No materials? Illustrative benchmark record (sample data). Height of one valley benchmark above a fixed reference, in meters. Drought years were 2012–2016 and 2020–2022; 2017–2019 were wetter. Teaching numbers, not survey data.
| Year | 2006 | 2010 | 2013 | 2016 | 2019 | 2022 |
|---|---|---|---|---|---|---|
| Height (m) | 3.55 | 3.20 | 2.95 | 2.60 | 2.52 | 2.20 |
Guided Exercises ~15 min
Use your model data and the benchmark record.
Independent Practice ~10 min
The argumentation lab.
Write a CER argument on one question: “Should groundwater pumping in the valley be limited even if some farmland goes out of production?” or “Is subsidence mainly caused by drought or by human choices?” Use at least two pieces of evidence from at least two kinds of sources (your model data, the benchmark rates, the reading) and explain the mechanism. Name who bears the costs of each choice.
Exchange arguments with a partner. Respond in writing to their strongest point, and say whether their evidence shows a cause or only a correlation.
Closure ~5 min
Water shaped where the valley’s people live, and their pumping is now reshaping the ground. Next phase we turn the basin into a model we can run.
How confident are you that you can I can explain with evidence how water availability shaped a valley and argue about groundwater management.
Exit ticket: compare how the sponge and the clay recovered. Why does that difference matter for storing water in future wet years?
Teacher notes
Timing: spans two 50-minute periods: day 1 the model lab and rate calculations; day 2 the written argument and partner exchange.
Materials (per team): two kitchen sponges, modeling clay or play dough, a shallow tray of water, a stack of books or a 1 kg bag of rice, a mm ruler, an index card, goggles.
Sensitivity: farmworkers, rural households and growers are all stakeholders; insist that arguments treat each with respect. Some students’ families may farm or depend on wells.
Listen for: “refilling the aquifer fixes the sinking”; treating correlation as proof. The benchmark record and the 6.5 m pole are sample data. Reading: Earle, Physical Geology, chapter 14.
Support / stretch: give a CER frame with sentence starters (“The data show…”, “This happens because…”). Stretch: research one real sinking city or farm region outside our country and compare its cause with the valley’s.