design and run a controlled test of a classifier, record results in a confusion matrix, and calculate accuracy, sensitivity and specificity.
Instruction
In Semester A you watched a classifier learn. Now you will test one as a scientist would, because the approved course asks you to use the scientific method to test a diagnostic tool built with machine learning.
The method. Ask a question (does the background color of a card change how accurately the model classifies it?). State a hypothesis that could be wrong (accuracy will be lower on cards photographed against a colored background than against white). Change one independent variable (background), measure a dependent variable (correct or incorrect), and hold everything else controlled (same model, lighting, distance, cards). Test enough cases: at least 20 per condition.
The confusion matrix. For a two-class test (say “condition present” versus “absent”), every result falls in one of four boxes. True positive (TP): present, and the model says present. False negative (FN): present, but the model says absent, a missed case. False positive (FP): absent, but the model says present, a false alarm. True negative (TN): absent, and the model says absent.
A worked example (illustrative numbers). A model is tested on 200 images: 50 with the condition and 150 without. It flags 42 of the 50 (TP = 42, FN = 8) and wrongly flags 15 of the 150 (FP = 15, TN = 135).
| Model: present | Model: absent | |
|---|---|---|
| Truly present (50) | TP 42 | FN 8 |
| Truly absent (150) | FP 15 | TN 135 |
Accuracy = (TP + TN) ÷ total = (42 + 135) ÷ 200 = 177 ÷ 200 = 88.5%. Sensitivity (how many real cases are caught) = TP ÷ (TP + FN) = 42 ÷ 50 = 84%. Specificity (how many healthy cases are correctly cleared) = TN ÷ (TN + FP) = 135 ÷ 150 = 90%. Positive predictive value (when the model says present, how often it is right) = TP ÷ (TP + FP) = 42 ÷ 57 ≈ 73.7%.
Why several numbers? Accuracy alone can mislead. In screening, a missed case (FN) and a false alarm (FP) have different costs: a miss may delay treatment; a false alarm causes worry and extra tests. FDA decision summaries for AI screening devices report sensitivity and specificity for this reason, often with confidence intervals.
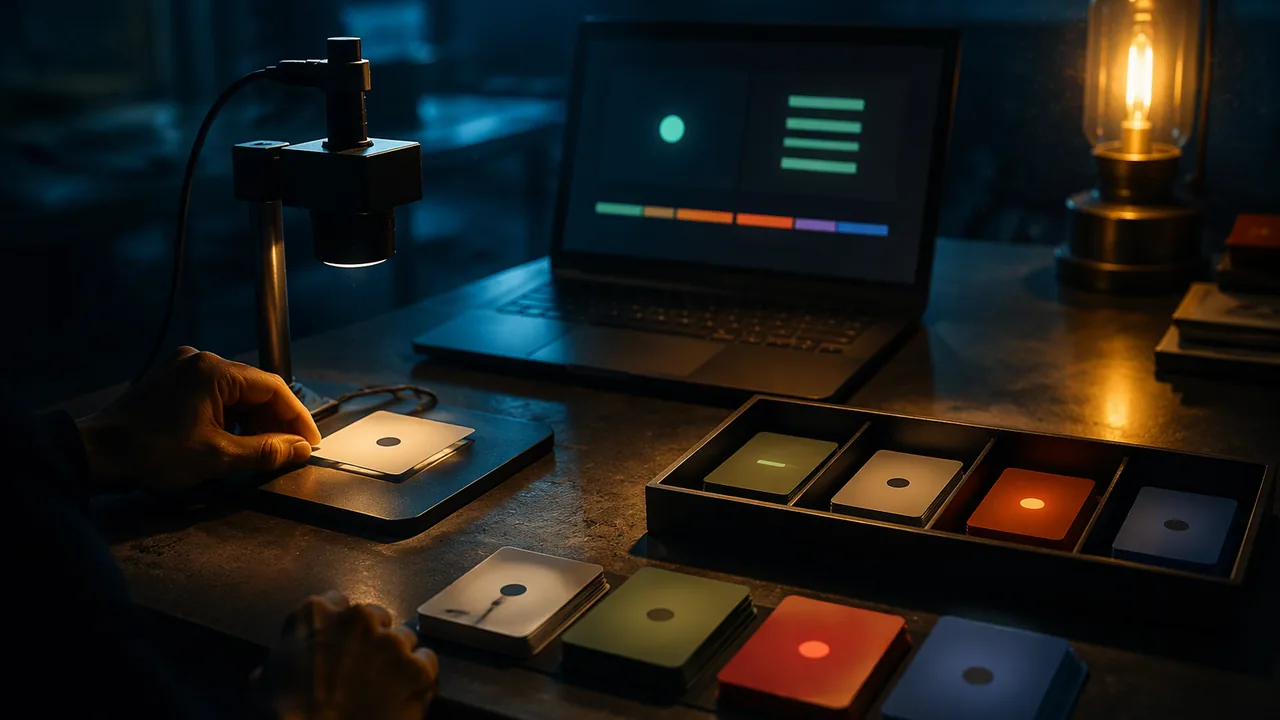
Today’s test. Your main data set is the recorded results sheet below: 20 cell-card drawings (round and sickle-shaped, as in Semester A) run through one trained image classifier under two conditions. You build the confusion matrices and do every calculation from it, by hand or in a spreadsheet. No account and no AI service is needed. If you would like to run your own version as well, the lab describes an optional route in Teachable Machine, which trains in your own browser with nobody signing in; you would use it only with a parent’s permission, never sign in or save to an account, and use only your own card drawings, never photographs of people. Whichever route you use, write the setup down so anyone could repeat it exactly; that is what makes a test scientific.
The recorded results sheet. The twenty cards below were run through one trained classifier twice, once against a white background and once against a colored one, with everything else held constant. The numbers are illustrative, written for this course. Sickle counts as positive. Build both confusion matrices from this sheet and calculate accuracy, sensitivity and specificity for each condition exactly as you would with your own run.
| Card | True label | Condition A (white) prediction | A confidence | Condition B (colored) prediction | B confidence |
|---|---|---|---|---|---|
| S1 | sickle | sickle | 0.98 | sickle | 0.91 |
| R1 | round | round | 0.97 | round | 0.86 |
| S2 | sickle | sickle | 0.95 | sickle | 0.88 |
| R2 | round | sickle | 0.64 | sickle | 0.79 |
| S3 | sickle | sickle | 0.97 | sickle | 0.72 |
| R3 | round | round | 0.99 | round | 0.92 |
| S4 | sickle | round | 0.61 | round | 0.74 |
| R4 | round | round | 0.95 | round | 0.71 |
| S5 | sickle | sickle | 0.99 | sickle | 0.83 |
| R5 | round | round | 0.92 | sickle | 0.63 |
| S6 | sickle | sickle | 0.93 | sickle | 0.69 |
| R6 | round | round | 0.90 | sickle | 0.68 |
| S7 | sickle | sickle | 0.90 | round | 0.66 |
| R7 | round | round | 0.98 | round | 0.85 |
| S8 | sickle | sickle | 0.96 | sickle | 0.81 |
| R8 | round | round | 0.96 | round | 0.74 |
| S9 | sickle | sickle | 0.88 | round | 0.58 |
| R9 | round | round | 0.87 | sickle | 0.60 |
| S10 | sickle | sickle | 0.94 | sickle | 0.77 |
| R10 | round | round | 0.93 | round | 0.80 |
Work the arithmetic yourself before you read on, then check: condition A gives TP 9, FN 1, FP 1, TN 9, and condition B gives TP 7, FN 3, FP 4, TN 6.
📖 Read for this lesson
The reading opens over the lesson; close it to come back to exactly where you were. The checks below draw on it.
Studio: Two backgrounds, twenty cards, one model
Question. Does changing one condition, such as the background behind a card, change a trained classifier’s sensitivity and specificity?
Materials
- The recorded results sheet in this lesson (20 cards, two conditions). It is the main data set and needs no computer, camera or internet.
- Confusion-matrix data sheets, which you can copy from the lab’s data table, and a calculator, phone or free spreadsheet program.
- Optional own run: 20 test cards (10 per class) drawn in Semester A or newly drawn, labeled on the back, and two backgrounds, such as a sheet of printer paper and a colored magazine page.
- Optional own run: steady light and a fixed distance, such as a desk lamp or a window with the blind set, and a ruler or a paper strip cut to the camera distance.
- Optional own run, only with a parent’s permission: a computer running Teachable Machine in the browser with no sign-in and nothing saved to an account, using the webcam or photographs of the cards uploaded as image files.
- If you use a desk lamp, keep its cord out of the way and do not touch the bulb, which gets hot.
- Keep any computer on a stable surface away from the table edge and any drinks.
- On the optional own run, show the model only your card drawings: no faces, people, rooms or personal information, and do not sign in or save to any account.
Procedure
- Write your question, hypothesis, independent variable, dependent variable and at least three controlled variables for the recorded test.
- Decide which class counts as positive before you start (the sheet treats sickle as positive).
- Condition A: read column A of the recorded results sheet and mark each card TP, FN, FP or TN by comparing the prediction with the true label. On the optional own run, show each card against the white background and record the prediction and confidence without looking at the label.
- Condition B: do the same for column B (on the own run, repeat with the colored background, in a different random order).
- Fill in both confusion matrices from your marks.
- Calculate accuracy, sensitivity and specificity for each condition, and check them against the totals given at the end of the sheet.
Data
| Condition | TP | FN | FP | TN | Accuracy | Sensitivity | Specificity |
|---|---|---|---|---|---|---|---|
| A (white) | |||||||
| B (colored) |
Analysis
- Was your hypothesis supported? Quote the numbers.
- With only 20 cards per condition, how much could one card change the sensitivity? What would you need to be more confident?
- Which error type (FN or FP) increased more under condition B, and what would that mean if this were a real screening tool?
- Name two variables you could not fully control and how they might have affected the results.
- How would you show this result visually on an exhibit board so a visitor understands it in ten seconds?
If you cannot do this studio in person: Choose one. All three earn full credit, all three yield two confusion matrices and the same five analysis questions. Option A, the recorded sheet (the default): use the 20-card, two-condition results sheet printed in this lesson, build both matrices by hand and complete every calculation and question. It needs no computer, no camera and no internet, and it carries a real effect to find. Option B, the recorded sheet in a spreadsheet: enter the 20 rows in a free spreadsheet program, add a column that marks each result TP, FN, FP or TN with a formula, and let the spreadsheet count the four boxes and compute the measures; check them against your hand count. Option C, your own run (optional, with a parent’s permission): draw 20 cards, photograph each card twice, once on each background, keeping the light and the distance fixed, and upload the images to a Teachable Machine model trained in the browser with no sign-in. Never sign in or save to an account, and use only card drawings.
Formative check
Work through these before moving on. They are not graded — they tell you whether the standard below has landed yet.
A test has TP = 18, FN = 2, FP = 6, TN = 74. What is its sensitivity?
For the same test (TP = 18, FN = 2, FP = 6, TN = 74), what is the specificity?
In a fair test you change one variable, measure the dependent variable, and keep the other variables .
Simulation & tools
Optional: train your own classifier (no account)
This step is optional, and it needs a parent’s permission. The recorded results sheet in this lesson is the main data set and supports every calculation. If you want to repeat the experiment yourself, Teachable Machine trains in your own browser with no sign-in: do not sign in, do not save to Drive or any account, and use only your own card drawings, never photographs of people or your home. Create two classes and add about 30 samples per class from TRAINING cards only, all on a white background, using the webcam or uploaded photographs. Train, then keep the Preview panel open and test your 20 TEST cards under conditions A and B. Write down how many samples you used, the background, the lighting and the camera distance, so that anyone could repeat your run. Ask: if you retrained with half the samples on colored backgrounds, which condition would you expect to improve? Without this step, answer the same question from the recorded sheet: which cards changed between conditions, and what would more varied training samples have to teach the model?
Open Teachable Machine ↗ · Teachable Machine, Google · free to use; Google terms (models train in the browser)
How confident are you that you can design and run a controlled test of a classifier and calculate its accuracy, sensitivity and specificity?
Practice
Work these on paper or in your notebook, then open Check your answer. Aim for all of Fluency and Application; try at least one Challenge.
Printable version: this unit’s practice workbook (PDF)
Fluency
Build speed and accuracy with the core skill.
- Define the four boxes of a confusion matrix: TP, FN, FP, TN.
Check your answer
Answer: TP: present, and the model says present. FN: present, but the model says absent (a missed case). FP: absent, but the model says present (a false alarm). TN: absent, and the model says absent.Decide which class counts as positive before you start; the lesson’s sheet treats sickle as positive. - Write the formula for accuracy, sensitivity, specificity and positive predictive value.
Check your answer
Answer: Accuracy = (TP + TN) / total. Sensitivity = TP / (TP + FN). Specificity = TN / (TN + FP). PPV = TP / (TP + FP).Sensitivity is how many real cases are caught; specificity is how many healthy cases are cleared; PPV is how often a positive result is right. - In the background experiment, name the independent variable, the dependent variable, and three controlled variables.
Check your answer
Answer: Independent: background (white or colored). Dependent: whether each classification is correct or incorrect. Controlled: the same model, lighting, distance and cards.Change one variable, measure one, hold everything else the same.
Application
Use the skill in context. Show your reasoning.
- From the recorded sheet, condition A gives TP 9, FN 1, FP 1, TN 9. Compute accuracy, sensitivity, specificity and PPV.
Check your answer
Answer: Accuracy 90%, sensitivity 90%, specificity 90%, PPV 90%.(9 + 9) / 20 = 18 / 20 = 90%; 9 / (9 + 1) = 90%; 9 / (9 + 1) = 90%; 9 / (9 + 1) = 90%. - Condition B gives TP 7, FN 3, FP 4, TN 6. Compute accuracy, sensitivity, specificity and PPV (to one decimal place). Was the hypothesis (accuracy lower on the colored background) supported?
Check your answer
Answer: Accuracy 65%, sensitivity 70%, specificity 60%, PPV about 63.6%. Yes: accuracy fell from 90% to 65%.(7 + 6) / 20 = 13 / 20 = 65%; 7 / 10 = 70%; 6 / (6 + 4) = 60%; 7 / (7 + 4) = 7 / 11 = 63.6%. - Using the sheet’s numbers, which error type increased more from A to B, false negatives or false positives? What would that mean in a real screening tool?
Check your answer
Answer: False positives rose by 3 (1 to 4); false negatives rose by 2 (1 to 3). False positives rose more: more false alarms, causing worry and extra tests (and the extra misses would delay treatment).FN: 3 – 1 = 2. FP: 4 – 1 = 3. A miss and a false alarm have different costs. - With 10 sickle cards per condition, how much does one card change the sensitivity? What would make you more confident in the result?
Check your answer
Answer: Each card changes sensitivity by 10 percentage points (1 / 10). More cards per condition would make the result more reliable; the lesson asks for at least 20 per condition, and with 20 positives one card moves sensitivity by 5 points.1 / 10 = 0.10 = 10 points; 1 / 20 = 0.05 = 5 points. - In the lesson’s worked example (TP 42, FN 8, FP 15, TN 135), show why accuracy (88.5%) alone hides something important.
Check your answer
Answer: Accuracy blends two different errors. Sensitivity is 84%, so 8 of 50 real cases are missed, and PPV is about 73.7%, so about a quarter of positive results are false alarms. Neither appears in the single 88.5% figure.42 / 50 = 84%; 42 / 57 = 73.7%; (42 + 135) / 200 = 88.5%. FDA decision summaries for screening devices report sensitivity and specificity for this reason.
Review
Keep earlier skills sharp.
- Review (Semester A, Unit 1): In Semester A, one model might learn the color of a card instead of its shape. How does the background experiment test a similar risk?
Check your answer
Answer: It changes only the background to see whether the classifier relies on something other than the cell’s shape; a big drop in accuracy suggests the model learned a shortcut from the training conditions.Training data carries the habits of whoever made it, including its backgrounds.
Testing a Classifier: A Plan Template and What One Card Changes
SLS original technique sheet; the arithmetic is on the page · SLS original
Why this reading. The lab asks for a test plan, two confusion matrices and a conclusion. This technique sheet gives a plan template with one worked entry and shows how much one card can move a result with only 10 cards per class, so you can write an honest conclusion. It is SLS original guidance.
Test plan template, worked once
| Part | Worked entry (illustrative) |
|---|---|
| Question | Does changing the background change the classifier’s sensitivity and specificity? |
| Hypothesis | A colored background will lower sensitivity |
| Independent variable | Background: white or colored |
| Dependent variables | Sensitivity and specificity |
| Controlled variables | Same 20 cards; same lamp position; camera 40 cm from the card; same order rules; same trained model |
What one card changes
| Positives tested | One card changes sensitivity by |
|---|---|
| 5 | 20.0 percentage points |
| 10 | 10.0 percentage points |
| 20 | 5.0 percentage points |
| 50 | 2.0 percentage points |
| 100 | 1.0 percentage points |
With 10 positive cards, one card moves sensitivity by 10 points: 9 of 10 is 90%, 8 of 10 is 80%. So a 10-point difference between conditions could be a single card. A conclusion should say so, and say what you would need: more cards, repeated runs, a different classifier.
Choosing the positive class
Decide before testing which class is positive. Then a false negative is a positive card the model missed, and a false positive is a negative card it flagged. For a screening tool, a missed case is usually the costlier error: say which error rose more, and why it matters.