present a prototype I built and tested, using the scientific method, in a well-designed tri-fold exhibit with a recorded demonstration.
Instruction
The science-fair tri-fold is a familiar format, but a good one is a piece of exhibition design: it has to catch a viewer from two meters away, explain a method in a minute and hold up to questions. This task brings together your prototype, your test and your design skills.
Your prototype. Choose one: the image classifier test from Lesson 2.2 (the provided results sheet, or your own optional no-account run on your drawings), your p5.js anomaly flag tested on the provided heart-rate series, or your rule-based clinic-guide chatbot. You must be able to demonstrate it in a screen recording.
The test. Follow the scientific method: question, hypothesis, method with controlled variables, at least 20 test cases, results in a confusion matrix or error table, calculated sensitivity and specificity (or, for the chatbot, the share of questions answered correctly, left unanswered and answered wrongly), and a conclusion. Your conclusion must state the limits of the test: small sample, one setting, illustrative data, and why the prototype is not a medical device.
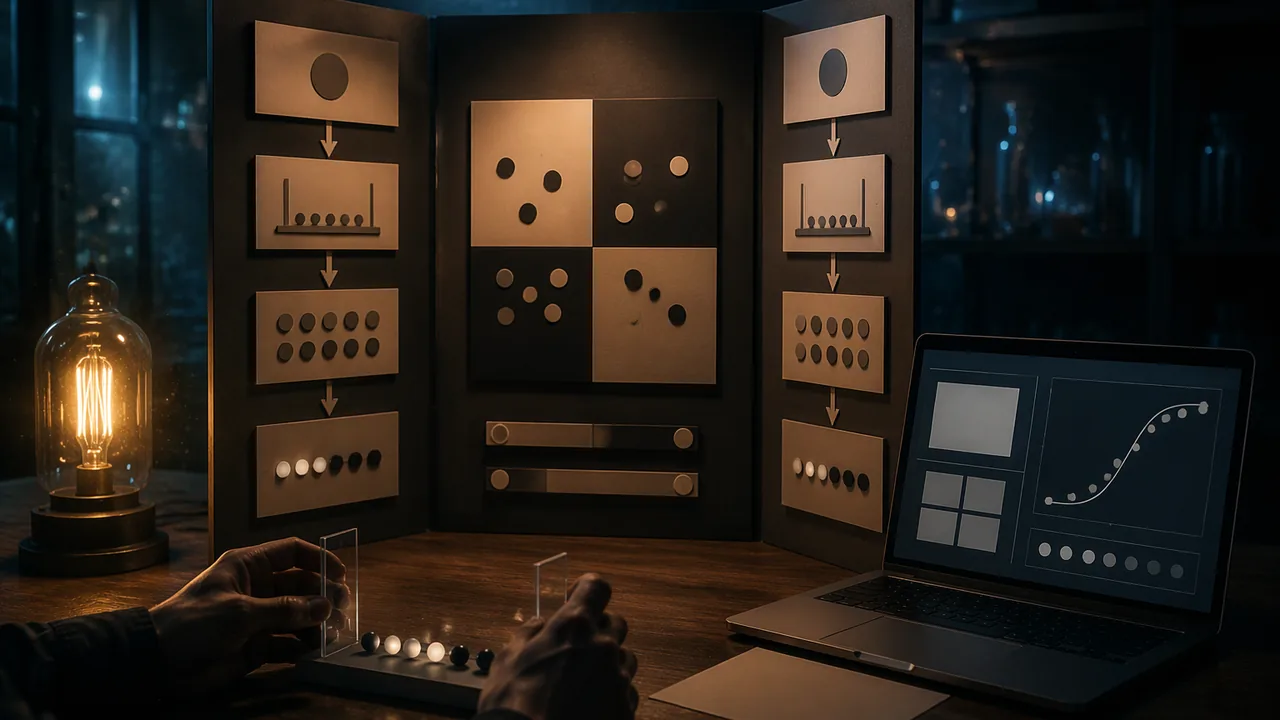
Board layout. A tri-fold has a center panel and two wings. Visitors read the center first, so put the title (a question, not a label: “Does the background fool the classifier?”) and the key result there, in the largest type and clearest graphic. The left wing carries the question, hypothesis and method; the right wing carries the full results, limits and next steps. Use your icon array or confusion-matrix graphic from this unit. Body type should be readable at a meter, about 24 points or larger when printed.
The demonstration station. Plan what a viewer does: hold up a card, type a question, move a slider. Write a one-line instruction on a card beside the laptop, so anyone at your home showing could try it without help. Make a screen recording of the demo; it goes in your walkthrough and serves as the backup.
Art and science together. Your board is judged as a media work as well as a report. Carry a visual identity across the board and demonstration: palette, typeface, one motif. Show one process photograph from your testing. The best boards make viewers curious enough to try the demo.
The statement. In about 700 words: what you built and how it works; your test and results, with every number checked; the limits; the design decisions for the board and demo; and one way an artist from Lesson 2.1 influenced your thinking.
The four stages. Stage 1: test plan and board thumbnail. Stage 2: draft board and demo self-critiqued after a day away, using the Lesson 2.3 questions, the exhibit criteria and the reading’s self-critique sheet (a family member or other adult may view the board as an optional visitor); submit the sheet and revision plan. Stage 3: final board, demo and statement. Stage 4: a curated home showing of your exhibit and a recorded walkthrough with a 90-second explanation and recorded answers to the course’s published visitor questions, plus a PDF or slide catalog of the exhibit. Share the catalog or recording online only with a parent’s permission.
📖 Read for this lesson
The reading opens over the lesson; close it to come back to exactly where you were. The checks below draw on it.
Formative check
Work through these before moving on. They are not graded — they tell you whether the standard below has landed yet.
Your classifier got 19 of 20 test cards right. What is the most honest conclusion?
On a tri-fold, the center panel should carry the title and the key result, because visitors read it first.
How confident are you that you can present a tested prototype through a well-designed exhibit and demonstration?
Unit 2 checkpoint
Do this before you start the task. It covers the whole unit and tells you what to review first.
Which artist’s system was rule-based rather than machine learning?
An RNN carries a running summary called its from one step of a sequence to the next.
Transformer models have replaced RNNs in many tasks by looking at all positions of a sequence at once.
A test has TP = 30, FN = 10, FP = 5, TN = 55. What is its sensitivity?
For the same test (TP = 30, FN = 10, FP = 5, TN = 55), what is the specificity?
A condition kept the same across a test so it cannot explain the results is a variable.
A tool with 90% sensitivity and 90% specificity is used where 2% of people have the condition. About what share of positive results are true?
A tool’s positive predictive value stays the same no matter how common the condition is in the group tested.
Which presentation of a screening result does research on risk communication suggest is easiest to understand?
Under rule version 1 (threshold 15 bpm), why is minute 11 (73 bpm) a false alarm?
The heart-rate flag sketch should state on screen that the data is illustrative and the flag is not a diagnosis.
Submit: tri-fold exhibit + demonstration station + 700-word technical and artist statement + recorded walkthrough and catalog
Task: Present a prototype you built and tested. Follow the scientific method with at least 20 test cases, a confusion matrix or error table, correctly calculated measures and a conclusion that states the limits of the test. Design a tri-fold board read center first, with honest data graphics and a demonstration station with a screen recording of the demo.
Submission workflow
- Stage 1 — Test plan. Question, hypothesis, variables, number of cases, and a thumbnail of the board layout.
- Stage 2 — Self-critiqued draft. Draft board and working demo self-critiqued after a day away against the exhibit criteria and the accuracy-claim questions (an optional family member or other adult may add a second sheet); submit the sheet and revision plan.
- Stage 3 — Revised final. Final board, demonstration station with a screen recording of the demo, and the 700-word statement with every calculation shown.
- Stage 4 — Showing and walkthrough. A curated home showing of the exhibit, a recorded walkthrough with a 90-second explanation and answers to the published visitor questions, and a PDF or slide catalog (online only with a parent’s permission).
How it is scored
| Criterion | What proficient looks like |
|---|---|
| Transdisciplinary integration (MA:Pr4A.III) | Experiment, code and design are synthesized into one exhibit with a consistent visual identity. |
| Production craft (MA:Cr3A.III) | Board, graphics and demonstration are purposeful, polished and compelling. |
| Scientific method and calculation (WHST.11-12.7) | Controlled test with at least 20 cases; measures calculated correctly; limits stated honestly. |
| Exhibit design (MA:Pr6A.II) | Reading order, type size and demonstration are designed for viewers at a home showing and on the recorded walkthrough. |
| Critique and revision (MA:Re9A.II) | Self-critique against the criteria after a day away leads to specific, defensible revisions of the board and demo. |
Tested Prototype Exhibit: The Full Brief, Exemplars, the Self-Critique Sheet and the Visitor Questions
SLS original assignment brief, criteria, exemplars, self-critique sheet and visitor questions; exemplar counts are invented; the anomaly-flag figures are computed from the constructed series in the Lesson 2.4 reading · SLS original
Why this reading. The task names a tri-fold, a demonstration station, a 700-word statement and a recorded walkthrough of a home showing, but a student cannot start without the brief itself: what to build and test, the exact criteria, an exemplar of what a finished entry says (including a confusion matrix worked out), data you can test a prototype against if you have none, the self-critique sheet for Stage 2 and the published visitor questions for Stage 4. It depends on no one but you.
The assignment
- Choose a prototype. (a) The classifier test from Lesson 2.2, using the provided recorded results sheet or your own optional no-account run on your card drawings; (b) your p5.js anomaly flag (Lesson 2.4), tested on the 24 readings of Series A and B in the Lesson 2.4 reading; or (c) a rule-based clinic-guide chatbot, tested on 20 questions.
- Test it with a question, a hypothesis, controlled variables, at least 20 test cases, a confusion matrix or error table, correctly calculated measures and a conclusion that states the limits.
- Build a tri-fold board read center first, with honest data graphics, and a demonstration station with a one-line instruction card and a screen recording of the demo.
- Write a 700-word technical and artist statement showing every calculation, and record a walkthrough: a 90-second explanation, the demo and your answers to the visitor questions below. Then hold a curated home showing for anyone you choose to invite, and make a PDF or slide catalog of the exhibit.
Criteria at four levels (SLS original)
| Criterion | 2 Developing | 3 Proficient | 4 Exemplary |
|---|---|---|---|
| Transdisciplinary integration | Experiment, code and design sit side by side | One visual identity across board and demo | Each part explains another: the graphic is the result, the demo is the method |
| Production craft | Some polish | Type, color and images consistent; demo works | A process photograph and a graphic a viewer grasps in ten seconds |
| Scientific method and calculation | At least 20 cases; some errors in the measures | Measures correct; limits stated | Also says what each error type would mean if this were a real screening tool |
| Exhibit design | Text small or crowded | Title question and key result in the center; body type 24 pt or larger | Reading order guides a viewer from question to result without help |
| Critique and revision | Notes taken | Revisions follow from notes | Revisions are tested and the change is shown on the board |
Board layout (SLS original guidance)
A common tri-fold presentation board is 36 inches tall with a 24-inch center panel and two 12-inch wings. Center: the title as a question, in type at least 72 point, and the key result in the largest graphic. Left wing: question, hypothesis, method, controlled variables. Right wing: full results, limits, next steps. Body type 24 point or larger so it can be read from about a meter. One process photograph. One line on the board: “Illustrative concept and prototype, not a medical device.”
Exemplar entry: the classifier option (invented results)
SLS original / illustrative. The counts are invented; they show the calculations and wording, and are not a result to copy. Title (a question): Does the background fool the classifier? Hypothesis: A colored background will lower sensitivity. Controlled: same 20 test cards, same lamp position, same 40 cm camera distance. Test: 20 cards (10 of each class) on a white background, then the same cards on a colored one; class 1 counts as positive.
| Condition | TP | FN | FP | TN | Accuracy | Sensitivity | Specificity |
|---|---|---|---|---|---|---|---|
| A: white | 9 | 1 | 1 | 9 | 90% | 90% | 90% |
| B: colored | 6 | 4 | 2 | 8 | 70% | 60% | 80% |
Worked: Condition B accuracy = (6 + 8) / 20 = 70%; sensitivity = 6 / (6 + 4) = 60%; specificity = 8 / (8 + 2) = 80%. Conclusion, with limits: “On our 20 cards, sensitivity fell from 90% to 60% when the background changed, and missed cases (FN) rose from 1 to 4. This was one classifier, one lamp and one camera; with only 10 positive cards, one card changes sensitivity by 10 points. This is a concept prototype, not a medical device.” If this were a screening tool, the rise in missed cases is the error that would matter most.
Exemplar entry: the anomaly-flag option (numbers you can reproduce)
Using version 2 of the rule on Series A and B of the Lesson 2.4 reading (24 readings, 3 true anomalies), the results are: limit 10, TP 3, FP 1, FN 0, TN 20, accuracy 23/24 = 95.8%; limit 15, TP 3, FP 0, FN 0, TN 21, accuracy 100%; limit 25, TP 0, FP 0, FN 3, TN 21, accuracy 21/24 = 87.5% with sensitivity 0. Caution for the conclusion: the anomalies were placed by the person who wrote the series, so 100% says the rule matches the author’s idea of an anomaly, not that it would work on real hearts.
Exemplar entry: the chatbot option
Ask the chatbot 20 questions you wrote in advance and tally each answer as correct, unanswered or wrong. Example (invented): 13 correct, 5 unanswered, 2 wrong. Report 13/20 = 65% correct, 5/20 = 25% unanswered and 2/20 = 10% wrong, and say that a wrong answer is worse than an unanswered one because a user may act on it.
The 90-second explanation
At 140 words per minute, 90 seconds is about 210 words (140 x 1.5). Suggested split: question and why it matters, 30 words; what you built, 40; what you tested and how many cases, 40; the result in one number, 30; the limit, 40; invitation to try the demo, 30 (total 210).
The published visitor questions (Stage 4)
Answer these on your walkthrough recording, after the 90-second explanation.
- How many test cases did you use, and why is that enough or not enough?
- Which error, a missed case or a false alarm, would matter more if this were a real tool, and how many of each did you get?
- What is one variable you could not control?
- Why is this prototype not a medical device?
The home showing and the catalog
Set the board up at home with the demo laptop and its instruction card. A family member or other adult may visit and try the demo; this is optional, and the walkthrough recording earns full credit on its own. Your catalog is a short PDF or slide set: a photograph of the whole board, a close-up of the key result, the demo instruction and a link to or file of the walkthrough. Share the catalog or recording online only with a parent’s permission, and keep names, faces of other people and personal information out of it.
The 700-word statement
| Section | Words |
|---|---|
| What I built and how it works | 150 |
| My test and results, every number checked | 200 |
| Limits, and why this is not a medical device | 100 |
| Design decisions for the board and demo | 150 |
| One artist from Lesson 2.1 and how they influenced me | 100 |
150 + 200 + 100 + 150 + 100 = 700.
Self-critique sheet for Stage 2
Put the draft board and demo away for a day, then fill in this sheet as if you were seeing them for the first time. A family member or other adult may fill in a second copy as an optional visitor.
| Question | Score 1-4 | What I saw |
|---|---|---|
| From two meters, can I read the title question and see the key result? | ||
| Can I redo one calculation from the numbers on the board and get the same answer? | ||
| Does the board say how many cases and what the limits are? | ||
| Could a viewer run the demo from the instruction card alone? What does the card say? | ||
| One revision that would help most: |
Sources: MedlinePlus, Pulse (U.S. National Library of Medicine) (medlineplus.gov)