identify key features of a function from a graph or table and calculate and interpret its average rate of change over an interval.
Instruction
A graph or table of a function answers many questions at once, if you know which features to read. This lab builds fluency with the most important ones.
Key features.
- Intercepts: where the graph meets the axes. The vertical intercept is the output when the input is 0; horizontal intercepts are inputs where the output is 0.
- Increasing and decreasing: intervals of input where the output rises or falls as you move left to right.
- Maximum and minimum: the greatest or least output, and where it occurs.
- Domain and range in context.
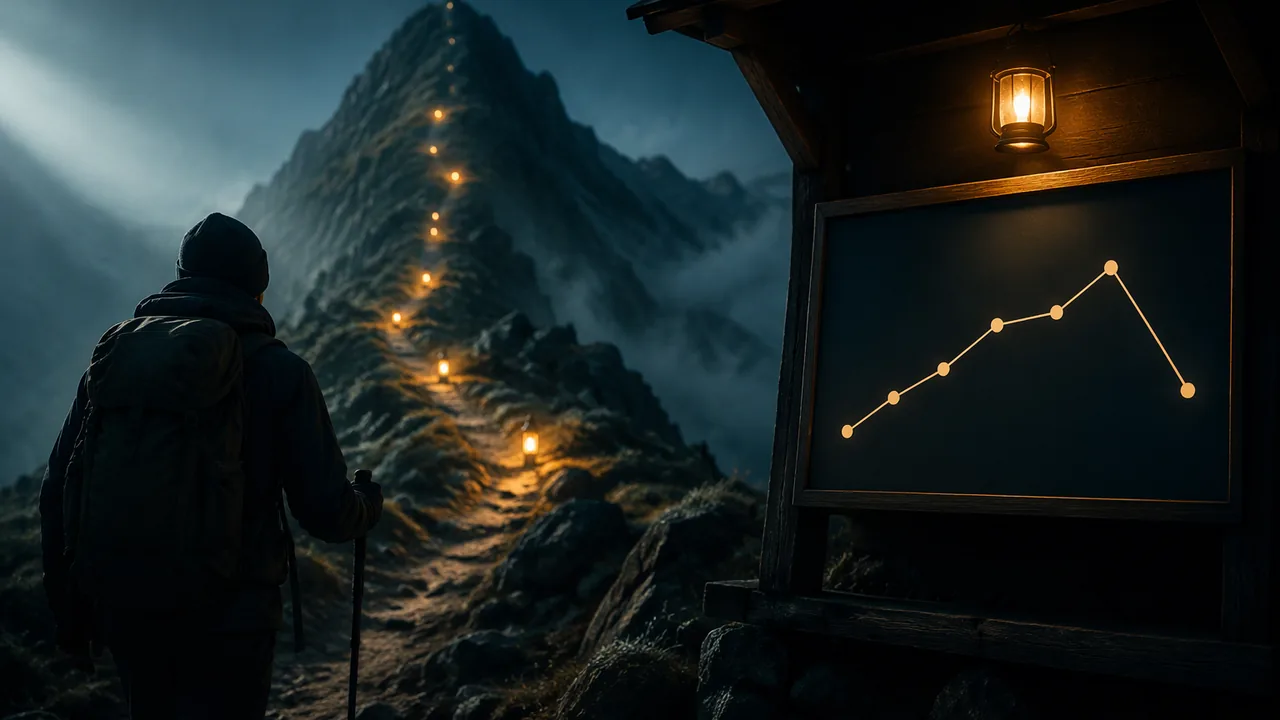
A hike (illustrative data). A hiker’s elevation E in feet is recorded each hour on a mountain trail:
| t (hours) | 0 | 1 | 2 | 3 | 4 | 5 |
|---|---|---|---|---|---|---|
| E(t) (feet) | 3,000 | 4,200 | 5,100 | 5,700 | 6,000 | 5,400 |
From the table: the hike starts at 3,000 feet, the vertical intercept. Elevation increases from t = 0 to t = 4 and decreases from 4 to 5. Of the recorded values, the maximum is 6,000 feet at 4 hours. We only know the elevation at whole hours; between readings the hiker might have gone slightly higher, and a careful answer says so.
Average rate of change. The average rate of change of f from x = a to x = b is
(f(b) − f(a)) ÷ (b − a)
which is the slope of the line through the two points on the graph. Its unit is output unit per input unit.
- Hour 0 to 1: (4,200 − 3,000) ÷ 1 = 1,200 feet per hour.
- Hour 3 to 4: (6,000 − 5,700) ÷ 1 = 300 feet per hour.
- Hour 4 to 5: (5,400 − 6,000) ÷ 1 = −600 feet per hour. Negative means descending.
- Hour 0 to 4: (6,000 − 3,000) ÷ 4 = 750 feet per hour.
Interpreting. The hourly rates fall, 1,200, 900, 600 and then 300 feet per hour, so the hiker climbed fastest at the start and slowed as the trail steepened or fatigue set in. The 0-to-4 average of 750 feet per hour is true overall but hides that slowing. Unlike a linear function, whose rate of change is the same on every interval, this function’s rate depends on which interval you choose, so always state the interval.
From a formula. For f(x) = x2, the average rate of change from 1 to 3 is (9 − 1) ÷ 2 = 4, and from 3 to 5 it is (25 − 9) ÷ 2 = 8. The rate itself is growing: a sign the function is not linear.
Practice. For each graph and table in the lab, list the intercepts, intervals of increase and decrease, and maximum or minimum, with units. Compute the average rate of change on the two intervals given and write one sentence comparing them in context.
📖 Read for this lesson
The reading opens over the lesson; close it to come back to exactly where you were. The checks below draw on it.
Formative check
Work through these before moving on. They are not graded — they tell you whether the standard below has landed yet.
From the hiking table, what is the average rate of change from hour 1 to hour 3?
For f(x) = x², the average rate of change from x = 1 to x = 3 is , and from x = 3 to x = 5 it is .
A negative average rate of change on an interval means the function is decreasing on average over that interval.
Sketch a graph of the temperature in your town over one day, from midnight to midnight. Label its maximum, minimum, and intervals of increase and decrease, state its domain and range, and compute an average rate of change for the morning.
How confident are you that you can read key features from a graph or table and interpret an average rate of change?
Practice
Work these on paper or in your notebook, then open Check your answer. Aim for all of Fluency and Application; try at least one Challenge.
Printable version: this unit’s practice workbook (PDF)
Fluency
Build speed and accuracy with the core skill.
- If f(x) = 3x2 − 6x + 5, find f(3).
Check your answer
Answer: f(3) = 14Substitute, then follow the order of operations; square the input first. - If f(x) = −2x2 + 5x − 8, find f(−4).
Check your answer
Answer: f(−4) = −60Substitute, then follow the order of operations; square the input first. - If f(x) = −x2 + 9, find f(1).
Check your answer
Answer: f(1) = 8Substitute, then follow the order of operations; square the input first. - Find the average rate of change of f(x) = x² from x = 2 to x = 5.
Check your answer
Answer: 7(25 − 4) ÷ 3. - Find the average rate of change of h(t) = −16t² + 64t from t = 0 to t = 1.
Check your answer
Answer: 48 - Find the average rate of change of f(x) = 4x − 3 from x = −2 to x = 6.
Check your answer
Answer: 4A linear function’s rate is its slope on every interval. - Where is f(x) = (x − 3)² increasing, and what is its minimum?
Check your answer
Answer: Increasing for x > 3; minimum 0 at x = 3
Application
Use the skill in context. Show your reasoning.
- A reservoir’s storage (million acre-feet, illustrative) at the start of months 0 to 4 is 2.1, 2.4, 2.9, 3.1, 3.0. Find the average rate of change from month 0 to 2 and from month 3 to 4, with units.
Check your answer
Answer: 0.4 million acre-feet per month; −0.1 million acre-feet per monthNegative means storage fell. - For the hike in Lesson 1.2 (4,200 ft at hour 1, 6,000 ft at hour 4), find the average rate of change from hour 1 to hour 4.
Check your answer
Answer: 600 feet per hour - A car’s value is V(t) = 24,000(0.85)^t dollars after t years. Find the average rate of change over the first 3 years.
Check your answer
Answer: About −$3,087.00 per yearV(3) ≈ $14,739.00.
Challenge
Stretch problems. Expect to think before you write.
- For f(x) = x², find the average rate of change from x = a to x = a + 2 in terms of a, and check your formula with a = 1.
Check your answer
Answer: 2a + 2; with a = 1: (9 − 1) ÷ 2 = 4((a + 2)² − a²) ÷ 2 = (4a + 4) ÷ 2.
Review
Keep earlier skills sharp.
- Find the slope of the line through (7, −7) and (−1, 8).
Check your answer
Answer: m = −15/8m = (8 − (−7)) ÷ (−1 − 7) = −15/8 - Solve and graph on a number line: −7x + 2 > 58
Check your answer
Answer: x < −8Subtract 2, then divide by −7 — dividing by a negative number reverses the inequality.
Shasta Lake, Month by Month: A Real Record to Read Features From
CDEC station SHA (Shasta Dam, USBR), monthly STORAGE, sensor 15, acre-feet; water years 2024-25 and 2025-26; retrieved Sept. 23, 2026 · Public domain (state Department of Water Resources, Data Exchange Center)
Why this reading. The lab says “for each graph and table in the lab”. Here is the table. It is real: the monthly storage of Shasta Lake, a large reservoir behind a federal dam in the far western United States, as published by the state’s Department of Water Resources through its Data Exchange Center (CDEC). The hiking table in the lesson was invented to teach the method. This one was not, and it behaves differently in one way worth noticing.
The record
CDEC station SHA, sensor 15, STORAGE, in acre-feet. One acre-foot is about 326,000 gallons. CDEC marks these values provisional and subject to revision; they were retrieved on September 23, 2026.
| Month | Water year 2024–25 (AF) | Water year 2025–26 (AF) |
|---|---|---|
| October | 2,596,000 | 2,547,440 |
| November | 2,770,000 | 2,681,432 |
| December | 3,477,000 | 3,295,388 |
| January | 3,492,000 | 3,642,626 |
| February | 3,561,000 | 3,822,800 |
| March | 4,067,000 | 4,090,291 |
| April | 4,396,000 | 4,140,355 |
| May | 4,151,000 | 3,950,012 |
| June | 3,788,000 | 3,557,728 |
| July | 3,238,000 | 3,054,369 |
| August | 2,852,000 | 2,629,600 |
The 2024–25 column is rounded to the nearest thousand acre-feet as CDEC printed it; the 2025–26 column is printed to the acre-foot. Two columns of the same quantity at two precisions is itself a fact about the data, and it limits how many digits your answers can honestly carry.
Worked features, water year 2025–26
- Vertical intercept. Count October as month 0. The starting value is 2,547,440 AF.
- Increasing. October through April. Decreasing. April through August.
- Maximum. 4,140,355 AF in April. Minimum of the values recorded. 2,547,440 AF in October. The lake was not read continuously, so a true peak could sit between two readings; say so when you answer.
Worked average rates of change, water year 2025–26
- October to April (6 months): (4,140,355 − 2,547,440) ÷ 6 = 1,592,915 ÷ 6 = 265,486 AF per month, filling.
- November to December (1 month): 3,295,388 − 2,681,432 = 613,956 AF per month, the fastest single month of the year.
- March to April (1 month): 4,140,355 − 4,090,291 = 50,064 AF per month. Still rising, but nearly flat: the reservoir is close to its peak.
- April to August (4 months): (2,629,600 − 4,140,355) ÷ 4 = −1,510,755 ÷ 4 = −377,689 AF per month, emptying.
Notice what the six-month average hides. October to April averages 265,486 AF a month, but the six monthly steps behind it are 133,992, 613,956, 347,238, 180,174, 267,491 and 50,064 — a December storm and an April that barely moved. An average rate of change is the slope of the straight line between two points, and it says nothing about the path between them. This is why every answer must name its interval.
Your turn
- For water year 2024–25, list the vertical intercept, the intervals of increase and decrease, and the maximum and minimum with their months and units.
- Compute the average rate of change for 2024–25 from October to April and from April to August. Write one sentence comparing each with the 2025–26 figure above.
- Which year peaked higher, and which drained faster? Answer with numbers and units, and round to a precision the 2024–25 column can support.
- Both years rise then fall, and both peak in April. Explain in one sentence why a straight-line model of storage against month would be a poor description, even though each individual average rate of change is a slope.
Sources: CDEC, Monthly data for station SHA (Shasta Dam) (cdec.water.ca.gov); Data Exchange Center (CDEC), Department of Water Resources (cdec.water.ca.gov)