apply the general multiplication rule with tree diagrams, reason correctly about conditional probabilities in screening problems, and use permutations and combinations to compute probabilities.
Instruction
The general multiplication rule (G.CP.A.7). Rearranging the definition of conditional probability gives
P(A and B) = P(A)·P(B | A) = P(B)·P(A | B)
It holds whether or not the events are independent. Only when they are independent does it simplify to P(A)·P(B) (PS.1).
Without replacement. Draw two cards from a standard 52-card deck without replacement. P(both aces) = P(first ace)·P(second ace | first ace) = (4/52)(3/51) = 12/2,652 = 1/221 ≈ 0.0045. The second probability is conditional because the deck has changed.
Checking against data. For the St. Louis winter table in Lesson 4.1: P(rain yesterday) × P(rain today | rain yesterday) = (688/2,256)(294/688) = 294/2,256, exactly the joint frequency. The rule is not a new fact but the definition read the other way.
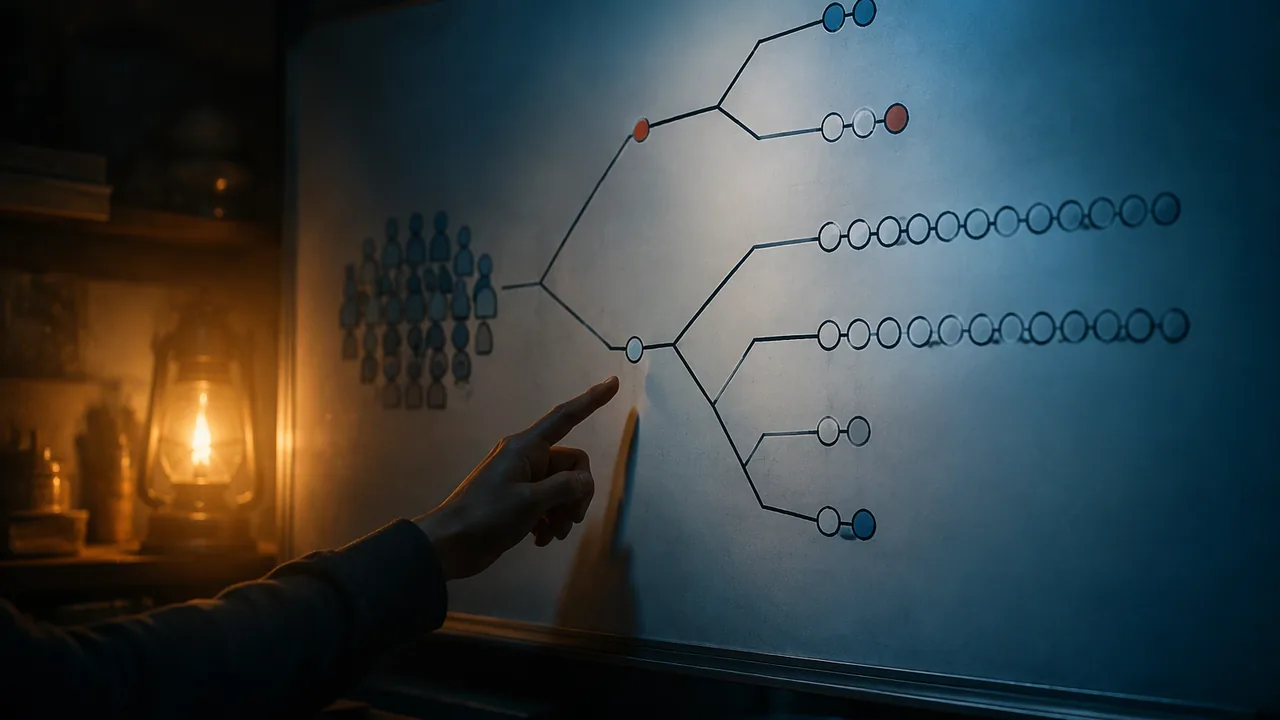
Tree diagrams and screening (illustrative numbers). Suppose a condition affects 1% of a population, and a screening test detects it 95% of the time when it is present (sensitivity) but also gives a positive result 10% of the time when it is absent (a specificity of 90%). These rates are illustrative, chosen for this lesson. Picture 10,000 people:
- 100 have the condition; 95% of them, 95, test positive.
- 9,900 do not; 10% of them, 990, test positive anyway.
Of the 1,085 positives, only 95 have the condition: P(condition | positive) = 95/1,085 ≈ 0.088. A positive result means about a 9% chance of having the condition, not 95%. The error of confusing P(positive | condition) with P(condition | positive) is common, even among professionals. The tree makes the difference visible: when a condition is rare, false positives from the large healthy group outnumber the true positives (G.CP.A.5). This is why a positive screening result is followed by a more accurate confirmatory test.
Counting (G.CP.A.8). When outcomes are equally likely, P(event) = (number of favorable outcomes) / (number of possible outcomes), and counting both takes technique.
- Permutations (order matters): choosing a president, vice-president and secretary from 25 club members can be done in 25P3 = 25 × 24 × 23 = 13,800 ways.
- Combinations (order does not matter): choosing a 3-person committee from 25 can be done in C(25, 3) = 13,800 / 3! = 2,300 ways. In general, C(n, k) = n! / (k!(n − k)!).
If the committee is chosen at random, P(two particular friends are both on it) = C(23, 1) / C(25, 3) = 23/2,300 = 0.01, because once both friends are chosen, any of the other 23 can fill the third seat.
A multistate lottery. Powerball, the game the Missouri Lottery sells along with most other states, asks players to choose 5 different white-ball numbers from 1 to 69 and a separate red Powerball number from 1 to 26. A play costs $2. The number of possible plays is C(69, 5) × 26 = 11,238,513 × 26 = 292,201,338, so a single play’s chance of matching all six is 1 in 292,201,338, the odds printed on the official prize chart (powerball.com, retrieved 2026-11-10). The same counting handles the lower prizes: matching all five white balls but not the Powerball can happen in C(5, 5) × 25 = 25 ways, so the odds are 1 in 11,688,053.52, again as published.
A counting surprise. In a group of 23 people, the probability that at least two share a birthday is 1 − (365 × 364 × … × 343)/36523 ≈ 0.507. This assumes 365 equally likely birthdays and ignores leap days. Computing the complement, “all different”, is far easier than counting every way to get a match.
📖 Read for this lesson
The reading opens over the lesson; close it to come back to exactly where you were. The checks below draw on it.
Formative check
Work through these before moving on. They are not graded — they tell you whether the standard below has landed yet.
A test catches 95% of cases of a condition that affects 1% of people, and gives a false positive to 10% of healthy people. You test positive. About how likely is it that you have the condition?
How many different Powerball plays are possible (5 white-ball numbers from 1-69 in any order, plus a Powerball number from 1-26)?
Drawing two cards without replacement, P(both aces) = (4/52)(/51) = 1/.
(a) Redo the screening problem with a prevalence of 10% instead of 1%, using a tree for 10,000 people, and explain why P(condition | positive) changes so much. (b) A club of 28 members randomly chooses 4 to present. What is the probability that you and your best friend are both chosen? Show the counting. Check your answers against the worked solution in the practice set, or ask a parent or guardian to check your tree.
How confident are you that you can use the general multiplication rule, trees and counting to find probabilities?
Practice
Work these on paper or in your notebook, then open Check your answer. Aim for all of Fluency and Application; try at least one Challenge.
Printable version: this unit’s practice workbook (PDF)
Fluency
Build speed and accuracy with the core skill.
- How many different 4-person committees can be chosen from 12 people?
Check your answer
Answer: 49512C4 - In how many ways can 2 different offices be filled from 7 candidates?
Check your answer
Answer: 427P2 - A group has 13 juniors and 0 seniors. If 4 are chosen at random, find the probability that exactly 4 are juniors.
Check your answer
Answer: 1 ≈ 1.0000Favourable combinations divided by total combinations. - In how many ways can 5 different offices be filled from 13 candidates?
Check your answer
Answer: 154,44013P5 - In how many ways can 2 different offices be filled from 8 candidates?
Check your answer
Answer: 568P2 - How many different 3-person committees can be chosen from 10 people?
Check your answer
Answer: 12010C3 - Two cards are drawn without replacement from a standard deck. Find P(both hearts).
Check your answer
Answer: (13/52)(12/51) = 0.0588 (= 1/17).General multiplication rule. - How many ways can a president, vice-president and secretary be chosen from 12 club members?
Check your answer
Answer: 1,320.Order matters: 12 × 11 × 10.
Application
Use the skill in context. Show your reasoning.
- (Illustrative rates) A screening test detects a condition 95% of the time when present and gives a false positive 10% of the time when absent. The condition affects 10% of a population. Find P(condition | positive) with a table for 10,000 people.
Check your answer
Answer: 1,000 have it: 950 test positive. 9,000 do not: 900 test positive. P(condition | positive) = 950/1,850 ≈ 0.514.Compare with about 0.088 when prevalence is 1%. - In Powerball (5 white-ball numbers from 1-69 plus a Powerball from 1-26), what is the probability that a single play matches all five white balls but not the Powerball?
Check your answer
Answer: 25/292,201,338 = 1/11,688,053.52 ≈ 8.56e-08, about 1 in 11,688,054 (the published odds for the $1 million prize are 1 in 11,688,053.52).C(69, 5) × 26 = 292,201,338 plays; C(5, 5) × 25 of them match the five white balls only. - What is the probability that at least two people in a class of 30 share a birthday (365 equally likely birthdays, ignoring leap days)?
Check your answer
Answer: ≈ 0.706.1 − (365 × 364 × … × 336)/365³⁰.
Challenge
Stretch problems. Expect to think before you write.
- A club of 28 members randomly chooses 4 to present. Find the probability that you and your best friend are both chosen, and explain the counting.
Check your answer
Answer: C(26, 2)/C(28, 4) = 325/20,475 ≈ 0.0159.Once both of you are in, choose the other 2 from the remaining 26.
Review
Keep earlier skills sharp.
- (Lesson 4.1) P(A) = 0.3, P(B) = 0.6, P(A and B) = 0.18. Are A and B independent?
Check your answer
Answer: Yes: 0.3 × 0.6 = 0.18. - (Unit 3) Why does a survey’s margin of error not cover nonresponse bias?
Check your answer
Answer: It measures only random sampling variability; nonresponse bias comes from who fails to respond, a systematic error.
Powerball by Counting: Nine Prize Tiers, Their Odds and One Real Draw
Powerball prize chart and odds (powerball.com/powerball-prize-chart) and the draw result for Saturday, November 7, 2026 (powerball.com/draw-result?gc=powerball&date=2026-11-08), retrieved November 10, 2026; tier counts computed for this course · SLS original (worked counting), with game rules and draw results published by the Multi-State Lottery Association
Why this reading. The lesson computes the number of possible Powerball plays and stops at the jackpot. The game has nine prize tiers, and every one of them is a counting problem of exactly the kind G.CP.A.8 asks for. Here are the rules, the nine counts worked and compared with the odds the game publishes, and the winner counts from one real national draw so the counts can be checked against what actually happened to millions of plays.
The rules
Powerball is the multistate game the Missouri Lottery sells. A play costs $2. You choose five different white-ball numbers from 1 to 69 and one red Powerball number from 1 to 26; the drawing picks the same way. There are C(69, 5) = 11,238,513 ways to choose the five and 26 for the Powerball, so 292,201,338 equally likely plays. (Powerball prize chart and rules, powerball.com, retrieved November 10, 2026. The optional Power Play add-on multiplies lower prizes and is left out of the counting.)
Counting every tier
To match exactly m of the five drawn white balls, a play chooses m of the 5 winning white numbers and 5 − m of the 64 losing ones: C(5, m)·C(64, 5 − m) ways. Multiply by 1 if the Powerball must match, by 25 if it must not. The last column is the odds printed on the official prize chart.
| Prize tier | Count | Winning plays | Odds from the count | Published odds |
|---|---|---|---|---|
| 5 + PB | C(5,5)·C(64,0)·1 | 1 | 1 in 292,201,338.00 | 1 in 292,201,338.00 |
| 5 | C(5,5)·C(64,0)·25 | 25 | 1 in 11,688,053.52 | 1 in 11,688,053.52 |
| 4 + PB | C(5,4)·C(64,1)·1 | 320 | 1 in 913,129.18 | 1 in 913,129.18 |
| 4 | C(5,4)·C(64,1)·25 | 8,000 | 1 in 36,525.17 | 1 in 36,525.17 |
| 3 + PB | C(5,3)·C(64,2)·1 | 20,160 | 1 in 14,494.11 | 1 in 14,494.11 |
| 3 | C(5,3)·C(64,2)·25 | 504,000 | 1 in 579.76 | 1 in 579.76 |
| 2 + PB | C(5,2)·C(64,3)·1 | 416,640 | 1 in 701.33 | 1 in 701.33 |
| 1 + PB | C(5,1)·C(64,4)·1 | 3,176,880 | 1 in 91.98 | 1 in 91.98 |
| PB only | C(5,0)·C(64,5)·1 | 7,624,512 | 1 in 38.32 | 1 in 38.32 |
Every counted odds value agrees with the published one to the cent. Any prize at all: 11,750,538 of 292,201,338 plays, a probability of 0.0402, or 1 in 24.87, the “overall odds” on the chart (1 in 24.87). Check one line yourself: for “3”, C(5, 3) = 10 choices of which three winning numbers, C(64, 2) = 2,016 choices of the two losers, 25 non-matching Powerballs, 10 × 2,016 × 25 = 504,000, and 292,201,338 / 504,000 = 579.76.
One real draw: Saturday, November 7, 2026
Winning numbers 3, 36, 37, 56, 61, Powerball 21, with the Power Play multiplier 2x. The estimated jackpot was $20 million (cash value $8.6 million). The Multi-State Lottery Association’s results page lists, for each tier, the winners without Power Play and the winners with it, across all participating states. A play either added Power Play or did not, so the two columns together count every winning play once. (Retrieved November 10, 2026.)
| Tier | Winners without Power Play | Winners with Power Play | All winning plays | Prize (before multiplier) | Plays sold, implied |
|---|---|---|---|---|---|
| 5 + PB | 0 | 0 | 0 | Jackpot (est. $20 million) | — |
| 5 | 0 | 0 | 0 | $1,000,000 | — |
| 4 + PB | 18 | 1 | 19 | $50,000 | — |
| 4 | 218 | 69 | 287 | $100 | — |
| 3 + PB | 584 | 166 | 750 | $100 | — |
| 3 | 13,845 | 4,615 | 18,460 | $7 | 10.70 million |
| 2 + PB | 12,096 | 4,245 | 16,341 | $7 | 11.46 million |
| 1 + PB | 97,060 | 33,198 | 130,258 | $4 | 11.98 million |
| PB only | 229,337 | 78,558 | 307,895 | $4 | 11.80 million |
The last column is a model check. If N plays were made with numbers chosen at random, the expected number of winners in a tier is N × (its probability), so N ≈ (winners) × (the tier’s odds). The results page does not state N, but the four tiers with thousands of winners estimate it: 3 10.70 million, 2 + PB 11.46 million, 1 + PB 11.98 million, PB only 11.80 million. Those four estimates agree to within about 12 percent, which is the kind of agreement random plays would produce. The tiers with only a few hundred winners (4 + PB with 19, 4 with 287, 3 + PB with 750) scatter more widely, as small counts should: their estimates run from 10.5 to 17.3 million. Nobody won the jackpot or the $1,000,000 prize. With about 11.5 million plays, the chance that no play matches all six is (1 − 1/292,201,338)11,500,000 ≈ 0.961, so a draw with no jackpot winner is the usual result, not a surprise.
What to do
- Verify two rows of the counting table by hand, including one with the Powerball and one without.
- Compute P(at least one prize) and P(no prize) for a single play, and for two plays with different numbers (careful: the second is not simply doubled).
- Using the implied-plays column, explain in three sentences why the jackpot row shows zero winners and whether that is surprising. Check your explanation against the (1 − 1/292,201,338)N calculation above, or ask a parent or guardian to read it.
- Then do the lesson’s committee problem (a club of 28, 4 chosen at random, you and a friend both chosen) with the same C(n, k) reasoning.
Sources: Powerball: prize chart and odds (powerball.com); Powerball: draw result for Saturday, November 7, 2026 (powerball.com)