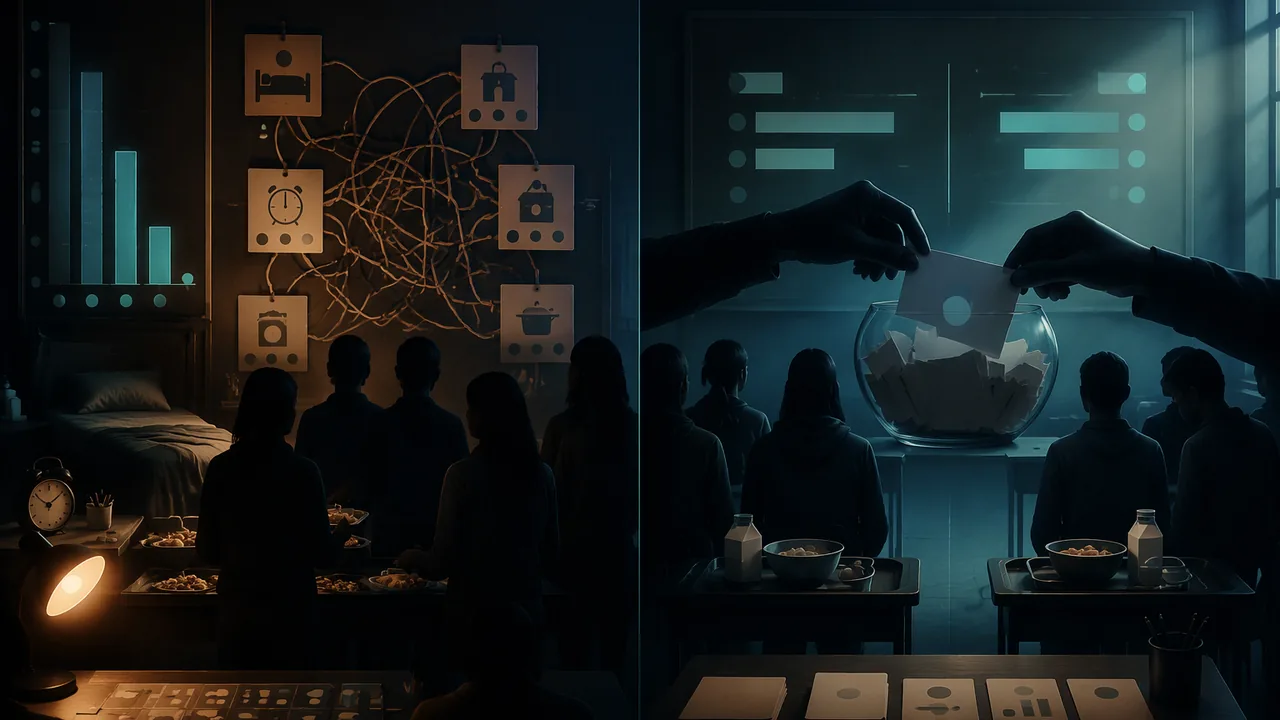
distinguish sample surveys, observational studies and experiments, explain how randomization works in each, and design a controlled experiment that could support a causal conclusion.
Instruction
A2.DS.A.3 names three ways of producing data, and each can answer a different kind of question.
- Sample survey: select a random sample to estimate something about a population. Randomization, in the form of random selection, lets you generalize to the population.
- Observational study: observe individuals and measure variables without influencing them. It can show association, but not cause and effect.
- Experiment: deliberately impose treatments on experimental units and measure the response. Randomization, in the form of random assignment to treatments, lets you conclude that the treatment caused the difference.
Why observational studies cannot settle causation. Suppose students who eat breakfast have higher grades on average. Breakfast might help, or families who make sure students eat breakfast might differ in many ways: sleep, work schedules, stability. These are confounding variables, whose effects are mixed up with the effect of breakfast. You can measure and adjust for confounders you think of, but never for the ones you don’t.
The principles of experimental design.
- Comparison / control. Compare the treatment with a control group (no treatment, a placebo, or the current standard), so outside influences affect both groups.
- Random assignment. Let chance decide which unit gets which treatment. This balances confounders, known and unknown, between groups on average. It is the step that turns association into causation.
- Replication. Use enough units that chance differences between groups tend to even out.
- Blocking (optional). Group similar units (for example by grade level) and randomize within each block, to reduce variability, just as stratifying does in sampling.
Placebos and blinding. People often respond to the belief that they are being treated (the placebo effect). A placebo, an inactive treatment that looks like the real one, controls for that belief. In a double-blind experiment, neither the subjects nor the people measuring the response know who got which treatment, so expectations cannot bias the results.
A historical case. The 1954 field trial of the Salk polio vaccine in the United States, one of the largest public-health experiments ever run, used two designs in different areas. In some, the vaccine was offered to second graders whose parents consented, and all first and third graders were counted as controls. In others, children in grades 1 to 3 whose parents consented were randomly assigned to vaccine or to a placebo injection, double-blind. In the randomized areas the vaccinated children had 16.4 paralytic polio cases per 100,000 and the placebo group 57.1, a reduction of 71%. In the observed-control areas the rates were 17.1 and 45.5, a reduction of 62%. The two designs disagree because the observed-control comparison was not fair: the controls included children whose parents had refused consent, and the families who consented differed from those who did not (and from the other grades) in ways that bear on polio risk. Random assignment among consenting families removed that problem, so the randomized, placebo-controlled areas gave the more trustworthy comparison. The reading Three Designs, Three Kinds of Conclusion: The 1954 Polio Trial, a State Survey and a Headline works through the trial’s numbers, the Missouri Behavioral Risk Factor Surveillance System as a survey design, and four headlines to judge. The reading SPRINT: A Randomized Trial of 9,361 People, Read as a Design does the same for a modern NIH trial.
The scope of inference. Random selection lets you generalize to the population. Random assignment lets you conclude cause and effect. A study with both supports both. Most experiments use volunteers, so their causal conclusions strictly apply only to people like the volunteers.
Ethics. Experiments on people need informed consent, the freedom to withdraw, privacy for the data, and no treatment that could cause harm. In this course you will never be asked to disclose personal information to take part. Anonymous data and public datasets are always an alternative.
📖 Read for this lesson
The reading opens over the lesson; close it to come back to exactly where you were. The checks below draw on it.
Formative check
Work through these before moving on. They are not graded — they tell you whether the standard below has landed yet.
A researcher compares test scores of students who chose to join a tutoring program with those who did not. What kind of study is this, and what can it show?
Random assignment balances both known and unknown confounding variables between treatment groups, on average.
Random lets you generalize to a population; random lets you draw a cause-and-effect conclusion.
Record (or write) a 90-second argument about this claim: ‘Teens who use their phones after 10 p.m. get lower grades, so phones cause lower grades.’ Identify the type of study that could produce such a finding, name two confounders, and design a randomized experiment (units, treatments, control, assignment, response, blinding if possible) that could test a causal version of the claim. Then respond to this model design in two sentences, one strength and one improvement: ‘Ask 60 volunteer students to keep their phones in another room after 10 p.m. for two weeks, and compare their grades with last year’s grades.’ (Hint: is there random assignment? Is there a control group?) A written answer earns equal credit with a recorded one, and you may talk your argument through with a parent or guardian first.
How confident are you that you can tell surveys, observational studies and experiments apart and design an experiment that could support a causal claim?
Practice
Work these on paper or in your notebook, then open Check your answer. Aim for all of Fluency and Application; try at least one Challenge.
Printable version: this unit’s practice workbook (PDF)
Fluency
Build speed and accuracy with the core skill.
- Survey, observational study or experiment? Researchers compare asthma rates of children living near busy highways with those living far from them.
Check your answer
Answer: Observational study.No treatment is assigned. - Survey, observational study or experiment? 60 volunteers are randomly assigned to type an essay with or without background music, and errors are counted.
Check your answer
Answer: Experiment. - Survey, observational study or experiment? A random sample of 1,000 adult residents of a state is asked whether they support a ballot measure.
Check your answer
Answer: Sample survey. - What does random assignment accomplish in an experiment?
Check your answer
Answer: It balances known and unknown variables between groups on average, so differences in the response can be attributed to the treatment. - What is a placebo, and why use one?
Check your answer
Answer: An inactive treatment that looks like the real one; it controls for the effect of believing you are being treated. - In a double-blind experiment, who does not know which treatment each subject received?
Check your answer
Answer: Both the subjects and the people measuring the response.
Application
Use the skill in context. Show your reasoning.
- Students who eat school breakfast have higher average test scores than those who don’t. Name two confounding variables and say whether this shows breakfast improves scores.
Check your answer
Answer: Possible confounders: sleep, family schedules, attendance, motivation. It does not show causation; the data are observational. - Design a randomized experiment to test whether a 10-minute walk before a quiz raises scores, using 40 volunteer students.
Check your answer
Answer: Randomly assign 20 to walk and 20 to sit for 10 minutes (random numbers on a roster), give all the same quiz under the same conditions, have the person who scores the quizzes not know the group, and compare mean scores with a randomization test. - In the 1954 polio vaccine field trial, some areas used ‘observed controls’: second graders whose parents consented got the vaccine, and all first and third graders were watched as controls (17.1 cases per 100,000 among the vaccinated, 45.5 among controls). In the randomized, placebo-controlled areas the rates were 16.4 and 57.1. Why is the observed-control comparison weaker?
Check your answer
Answer: Families who consented differed from those who did not (and from other grades), and the controls included children whose parents refused, so differences in polio rates could come from those differences rather than the vaccine. Random assignment with a placebo removes that confounding and the effect of expectations; it also shows a larger effect (a 71% reduction, against 62%).
Challenge
Stretch problems. Expect to think before you write.
- A coach wants to compare two training methods, but her 40 athletes come from two practice groups, and group 1 is much stronger at the start. Describe a blocked design and explain what blocking adds.
Check your answer
Answer: Treat each practice group as a block and randomly assign half the athletes in each group to each method; compare methods within blocks. Blocking removes the group-to-group difference from the comparison, so the treatment effect is estimated more precisely.
Review
Keep earlier skills sharp.
- For the data 12, 18, 18, 20, 22, 26, 27, 28, 34: find the mean, median, range and interquartile range. (Find the quartiles as the medians of the lower and upper halves, leaving out the overall median when the count is odd.)
Check your answer
Answer: mean = 22.78; median = 22.0; range = 22; IQR = 9.5 (Q1 = 18.0, Q3 = 27.5) - (Unit 2) Classify: cities with more police officers have more crimes, because larger cities have more of both.
Check your answer
Answer: Common response to a lurking variable (city size).
SPRINT: A Randomized Trial of 9,361 People, Read as a Design
Systolic Blood Pressure Intervention Trial (SPRINT), NCT01206062, participant flow and outcome measures as posted on ClinicalTrials.gov by the NHLBI (record fetched via the ClinicalTrials.gov API v2); retrieved November 10, 2026 · SLS original, with public-domain trial results from ClinicalTrials.gov (National Library of Medicine)
Why this reading. The lesson’s discourse task asks you to design a randomized experiment that could test a causal claim, and to check a design against a model. It helps to have seen a real one in numbers. Here is a large NIH trial, read purely as a design: who was assigned, how, what was measured, and what the numbers can and cannot support. The 1954 polio trial that the lesson describes is worked in the same way in the reading that accompanies it.
SPRINT: the Systolic Blood Pressure Intervention Trial
Registered as NCT01206062 on ClinicalTrials.gov, sponsored by the National Heart, Lung, and Blood Institute, run from October 2010 to July 2016 (primary completion). The question: for adults aged 50 and over with high systolic blood pressure and elevated cardiovascular risk, does treating to a systolic target below 120 mm Hg (intensive) prevent more heart attacks, strokes, heart failure and cardiovascular deaths than the standard target below 140 mm Hg? People with diabetes or a prior stroke were excluded.
The design, feature by feature. Allocation: randomized, parallel groups. Control: the standard treatment target, not a placebo, because withholding blood-pressure treatment would have been unethical. Blinding: participants and their clinicians knew the target, since the drugs had to be adjusted to reach it; the people who judged whether an event had occurred did not (ClinicalTrials.gov lists masking as “single: outcomes assessor”). Replication: 9,361 participants. Response: the number of participants with a first primary-outcome event over up to six years.
| Arm | Randomized | Primary-outcome events | Rate | Deaths from any cause | Death rate |
|---|---|---|---|---|---|
| Intensive (target < 120) | 4,678 | 243 | 5.19% | 155 | 3.31% |
| Standard (target < 140) | 4,683 | 319 | 6.81% | 210 | 4.48% |
Check the rates: 243 / 4,678 = 0.0519 and 319 / 4,683 = 0.0681. The intensive arm’s event rate is 0.76 times the standard arm’s. The trial’s own analysis, which accounts for how long each person was followed, reports a hazard ratio of 0.75 with 95% confidence interval 0.64 to 0.89 and P < 0.001; for deaths, 0.73 (0.60 to 0.90), P = 0.003. A secondary outcome tells a different story: all-cause dementia occurred in 149 intensive-arm participants and 176 standard-arm participants (3.19% and 3.76% of those randomized), hazard ratio 0.83 (0.67 to 1.04), P = 0.10. Same trial, same randomization, and a difference in the same direction that is not distinguishable from chance. Both results belong in an honest report.
What the randomization bought
Because chance decided each participant’s arm, the two groups of about 4,680 were alike, on average, in everything: age, weight, smoking, income, how conscientious they were about taking pills, and every characteristic nobody measured. The 76 fewer events in the intensive arm therefore cannot be explained by the intensive group having been healthier to start with. That is the argument an observational comparison of people who happen to have low blood pressure could never make, because people with naturally low blood pressure differ from people with high blood pressure in a hundred ways.
What it did not buy
Scope. Participants were volunteers who met the entry criteria; the causal conclusion applies to people like them. It says nothing directly about people with diabetes, who were excluded, or about people under 50. And an open-label design leaves one door open: participants who knew they were in the intensive arm might have changed other habits. The trial’s answer is that the outcome judges were blinded, so at least the measurement of events was not affected.
Back to the lesson’s claim
“Teens who use their phones after 10 p.m. get lower grades.” A finding like that comes from an observational study: nobody assigned phone use. Design the experiment the way SPRINT was designed, and name each feature: the units, the two treatments, random assignment by a generator, a response measured the same way for everyone, who can and cannot be blinded, and the population your conclusion would actually cover. Then say which confounders your randomization balances that the observational study could not, and compare your design with the lesson’s model design before you record your argument.
Sources: ClinicalTrials.gov, NCT01206062: Systolic Blood Pressure Intervention Trial (SPRINT), results section (clinicaltrials.gov); ClinicalTrials.gov API v2 record for NCT01206062 (clinicaltrials.gov)
Three Designs, Three Kinds of Conclusion: The 1954 Polio Trial, a State Survey and a Headline
1954 poliomyelitis vaccine field trial results as reported by Francis and colleagues, American Journal of Public Health, 1955; Missouri Department of Health and Senior Services, Behavioral Risk Factor Surveillance System (BRFSS) overview page; CDC, BRFSS home page; CDC BRFSS Prevalence Data (2011 to present), Missouri, 2024, general health status; retrieved November 5, 2026; the four headline cases are SLS original · SLS original, with published trial figures and public-domain U.S. and Missouri government survey data
Why this reading. The lesson’s last task says to “find or use a provided news headline” and judge it. Four headlines are provided below, with enough of each study behind them to judge. Before them are two real designs worth having in your head: the trial that settled the polio vaccine, and the survey that estimates Missouri’s health. The trial is the clearest example ever run of why one design supports a causal claim and another does not.
The 1954 polio vaccine field trial: two designs in one study
The trial had two arms, run in different parts of the country, because health officials disagreed about whether withholding a possible vaccine was acceptable.
Arm 1, randomized placebo control. In participating areas, children in grades 1–3 whose parents consented were assigned at random to receive either vaccine or a saline placebo. Neither the children, their parents, nor the doctors diagnosing polio knew which they had received.
Arm 2, observed control. In other areas, all consenting second-graders were offered vaccine, and first- and third-graders were counted as controls. Nothing was assigned; the comparison was between grades, and between children whose parents consented and children whose parents did not.
| Arm | Group | Children | Paralytic polio cases | Rate per 100,000 |
|---|---|---|---|---|
| Randomized placebo control | Vaccinated | 200,745 | 33 | 16.4 |
| Placebo | 201,229 | 115 | 57.1 | |
| Observed control | Vaccinated (grade 2, consented) | 221,998 | 38 | 17.1 |
| Controls (grades 1 and 3) | 725,173 | 330 | 45.5 |
Check the rates yourself: 33/200,745 × 100,000 = 16.4, and 115/201,229 × 100,000 = 57.1. In the randomized arm the placebo rate is 57.1/16.4 = 3.48 times the vaccinated rate, a reduction of 1 − 16.4/57.1 = 71%. In the observed arm the ratio is 45.5/17.1 = 2.66, a reduction of 62%.
Why the two arms disagree, and which to believe. The observed arm’s control group is not comparable to its treatment group. Its controls include children whose parents refused consent, and consent was more common in higher-income families — where, for reasons of early-childhood exposure, paralytic polio was more common. So the observed arm’s controls were on average at lower risk than its vaccinated children, which drags the apparent benefit down. Only the randomized arm can rule that out, because random assignment makes the two groups alike on average in everything, including the things nobody thought to measure. That is the whole argument for random assignment, and here it is worth nine percentage points of measured effect.
Note what the trial cannot tell you either way: it enrolled volunteers in selected districts, not a random sample of American children, so generalizing it rests on a judgment about similarity, not on the design.
The Missouri Behavioral Risk Factor Surveillance System: a design for the other question
The BRFSS is an ongoing telephone health survey of adults, conducted in all 50 states and coordinated by the federal Centers for Disease Control and Prevention (CDC). Nationally it was established in 1984 with 15 states and now completes more than 400,000 adult interviews a year. In Missouri it is run by the Department of Health and Senior Services (DHSS), which works with the University of Missouri-Columbia to make the calls. Households are randomly selected; listed and unlisted residential landline numbers and cell phone numbers are all included, and the interviewer does not ask for the respondent’s name. The interview takes about 25 minutes and covers health conditions, behaviors, preventive care and access to health care.
How big is the Missouri sample? In the CDC’s published BRFSS prevalence data for 2024, 7,271 Missouri adults answered the general-health question, and 20.07% of Missouri adults, after weighting, rated their health as fair or poor, with a 95% confidence interval of 18.82% to 21.32%. Because respondents are selected by a probability method, the BRFSS estimates population parameters — the share of all Missouri adults with a given condition or habit — and says how precisely.
What the BRFSS cannot do is establish cause. If it shows that adults without health insurance report worse health, no part of that design rules out the possibility that being in worse health affects employment, and employment affects insurance. Nobody assigned anything. Random selection bought generalization; it does not buy causation, and the two randomizations are not interchangeable.
| Random selection? | Random assignment? | Supports generalizing? | Supports causation? | |
|---|---|---|---|---|
| Polio trial, randomized arm | no | yes | by argument only | yes |
| Polio trial, observed arm | no | no | by argument only | no |
| Missouri BRFSS | yes | no | yes | no |
| Website click-in poll | no | no | no | no |
Four headlines to judge (SLS original)
These four cases were written for this lesson. The headlines are invented; each is built on a design that is common in real reporting. For each, name the design, the population, how subjects were chosen, what the conclusion would need, and at least one confounding variable if the design is observational.
A. “Students who play a musical instrument score higher in math.” — Researchers matched school records for 4,100 students in one large Missouri district and found that students enrolled in band or orchestra averaged 31 points higher on the state mathematics assessment than students who were not. No student was assigned to anything.
B. “Standing desks cut afternoon drowsiness, study finds.” — Ninety office workers at one company volunteered. Each was assigned by a random-number generator to a standing or a seated desk for four weeks, and all rated their alertness at 3 p.m. daily on the same 1–10 scale. The standing group averaged 0.8 points higher.
C. “Four in ten Missourians skipped dental care over cost.” — From a probability sample of 4,800 Missouri adults, weighted to match the state’s age, region and income distribution, with a reported margin of error of ±1.8 points.
D. “92% of readers say the new bus lanes are a failure.” — From a poll posted on a local news site over one weekend; 14,200 people clicked a response.
Three questions to settle across all four. Which one has the largest sample and the least trustworthy result, and why does that ordering not embarrass statistics? Which one supports a causal claim, and for whom exactly? And in case A, name two variables that could produce the 31-point gap without any music lesson ever causing anything — then say what study you would have to run instead, and why nobody runs it.
One thing to notice about B. It licenses a causal conclusion, and its subjects are ninety volunteers at one company. “Standing desks cut drowsiness” is a claim about everyone; the study supports “among these ninety volunteers, assignment to a standing desk raised mean self-rated alertness by 0.8 points.” Most of the distance between those two sentences is the headline writer’s, not the researcher’s, and learning to see exactly where a claim outruns its design is the skill this whole unit is for.
Sources: Missouri Department of Health and Senior Services, Behavioral Risk Factor Surveillance System (BRFSS) (health.mo.gov); Centers for Disease Control and Prevention, Behavioral Risk Factor Surveillance System (cdc.gov); CDC, BRFSS Prevalence Data (2011 to present), Missouri 2024 (data.cdc.gov dataset dttw-5yxu) (data.cdc.gov); University of Michigan School of Public Health, the 1955 polio vaccine trial announcement (sph.umich.edu)